Why Choose the GA4 Executive View Dashboard?
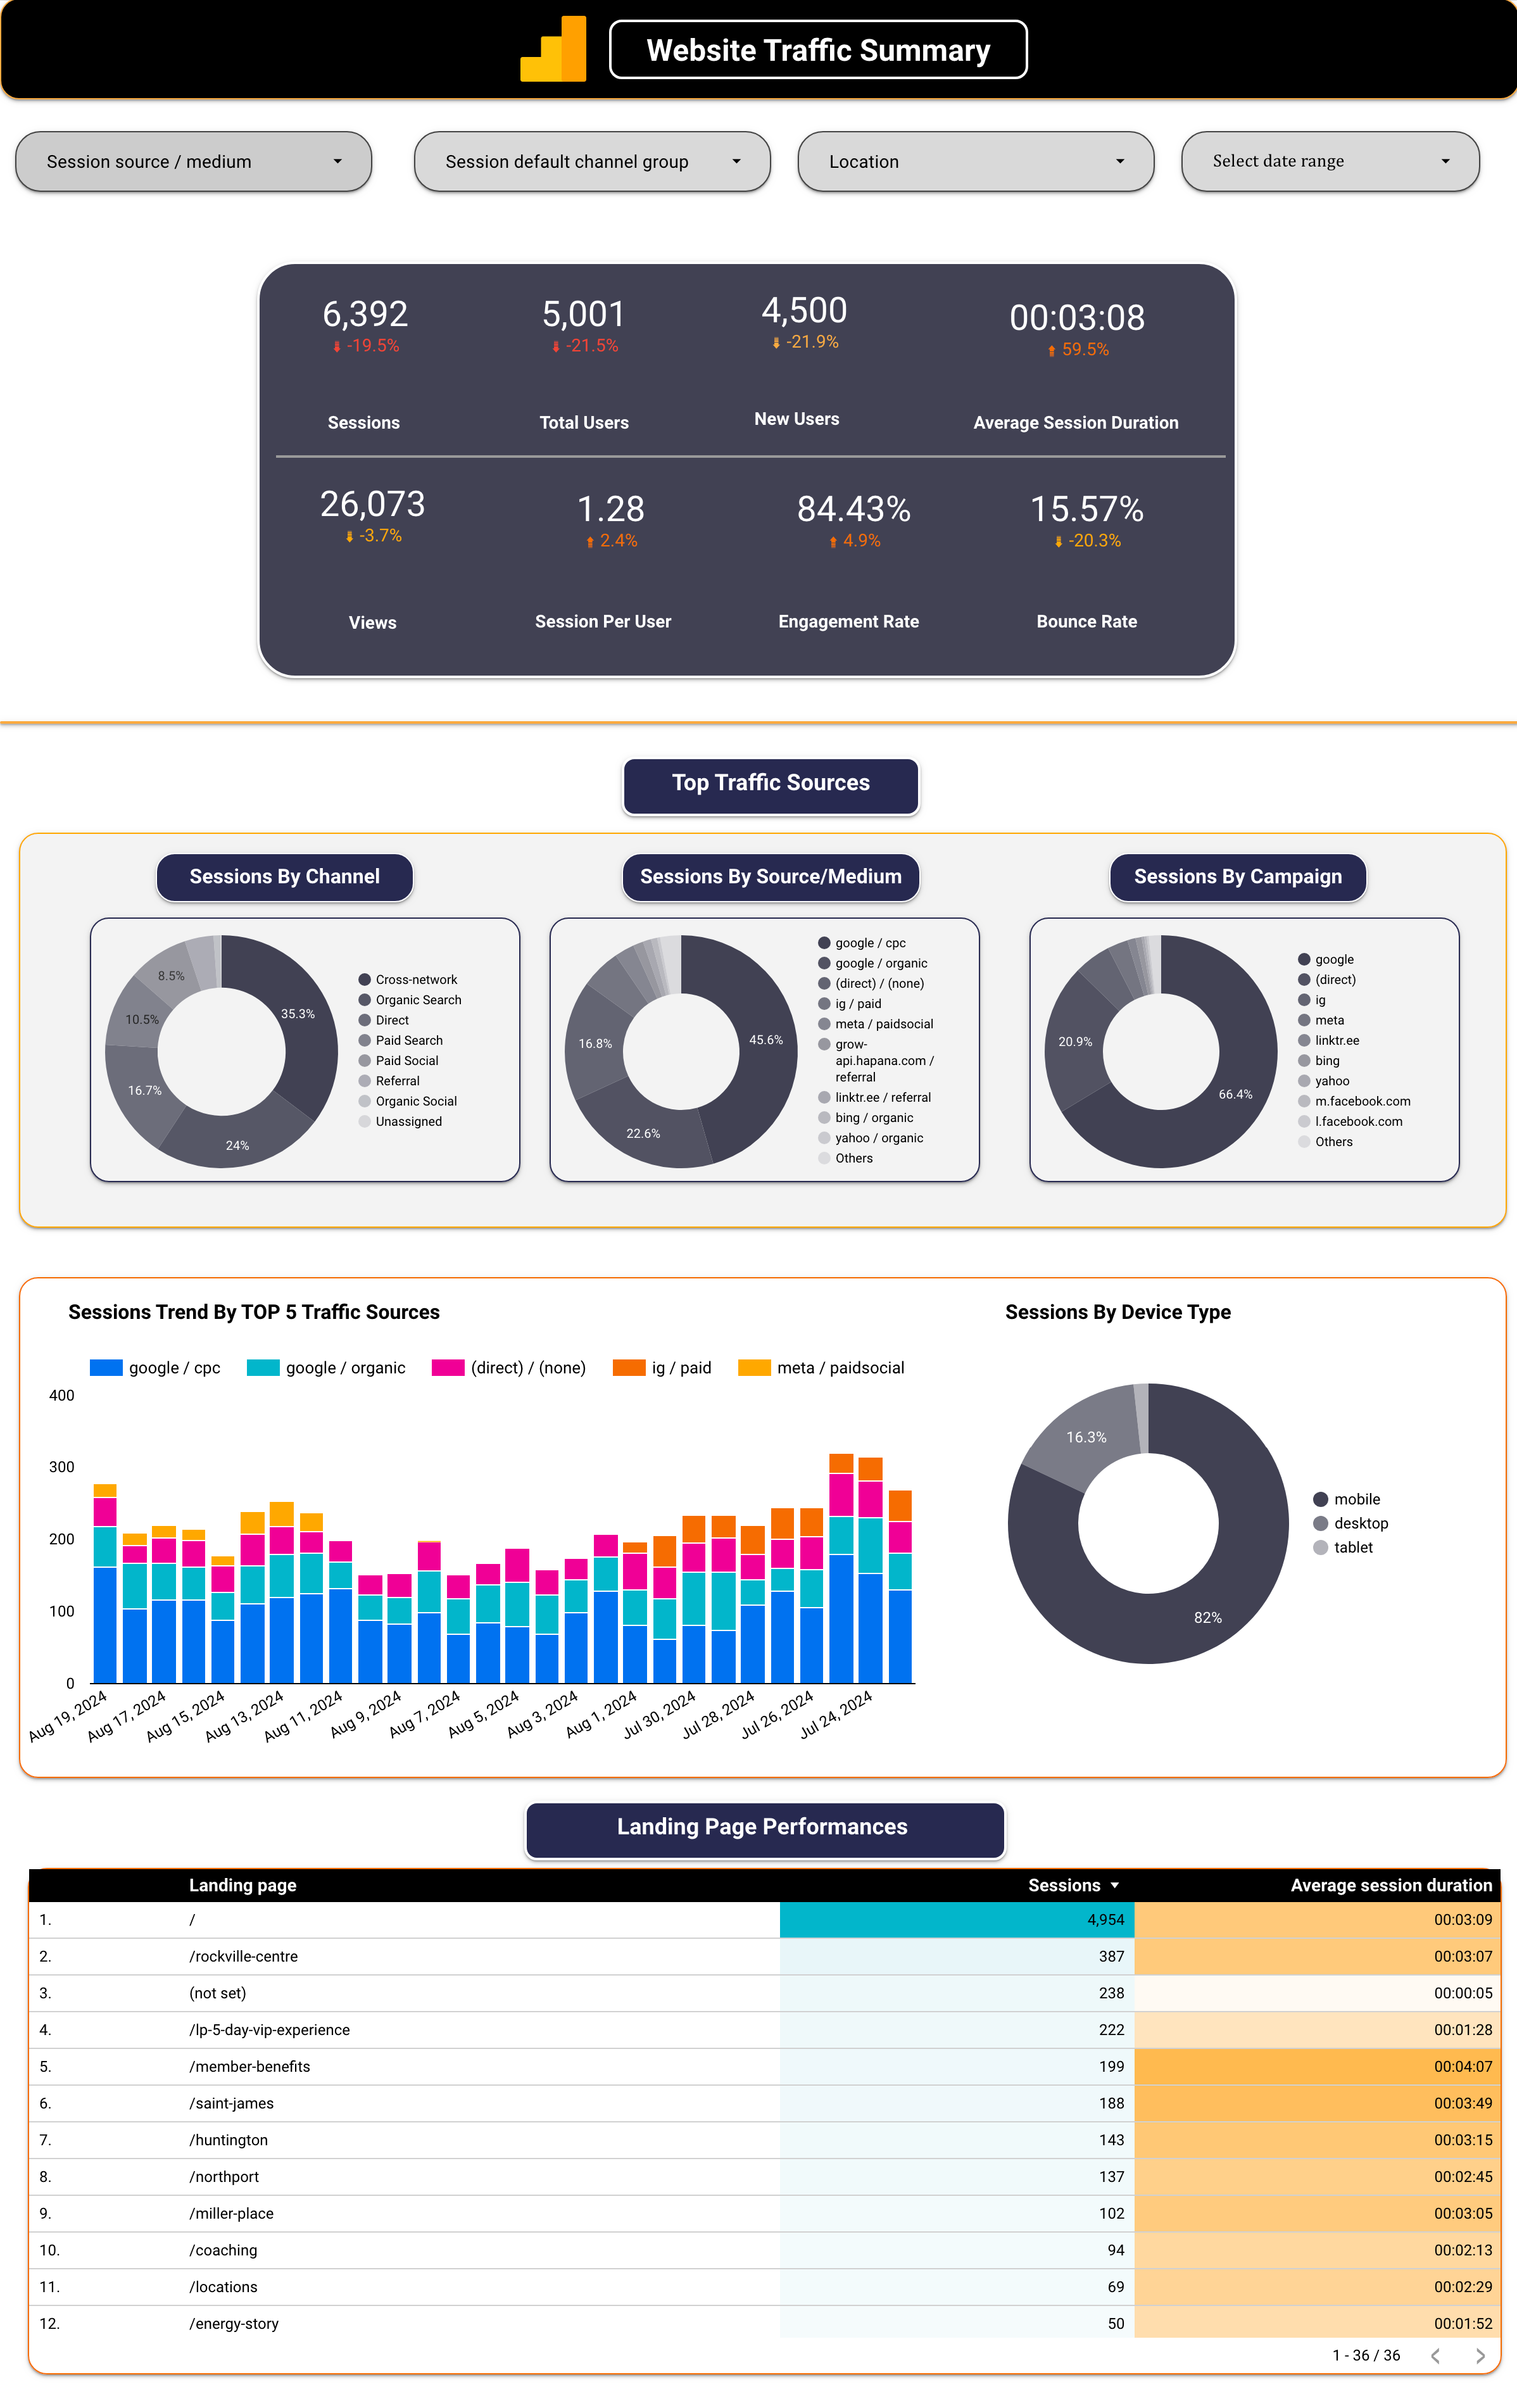
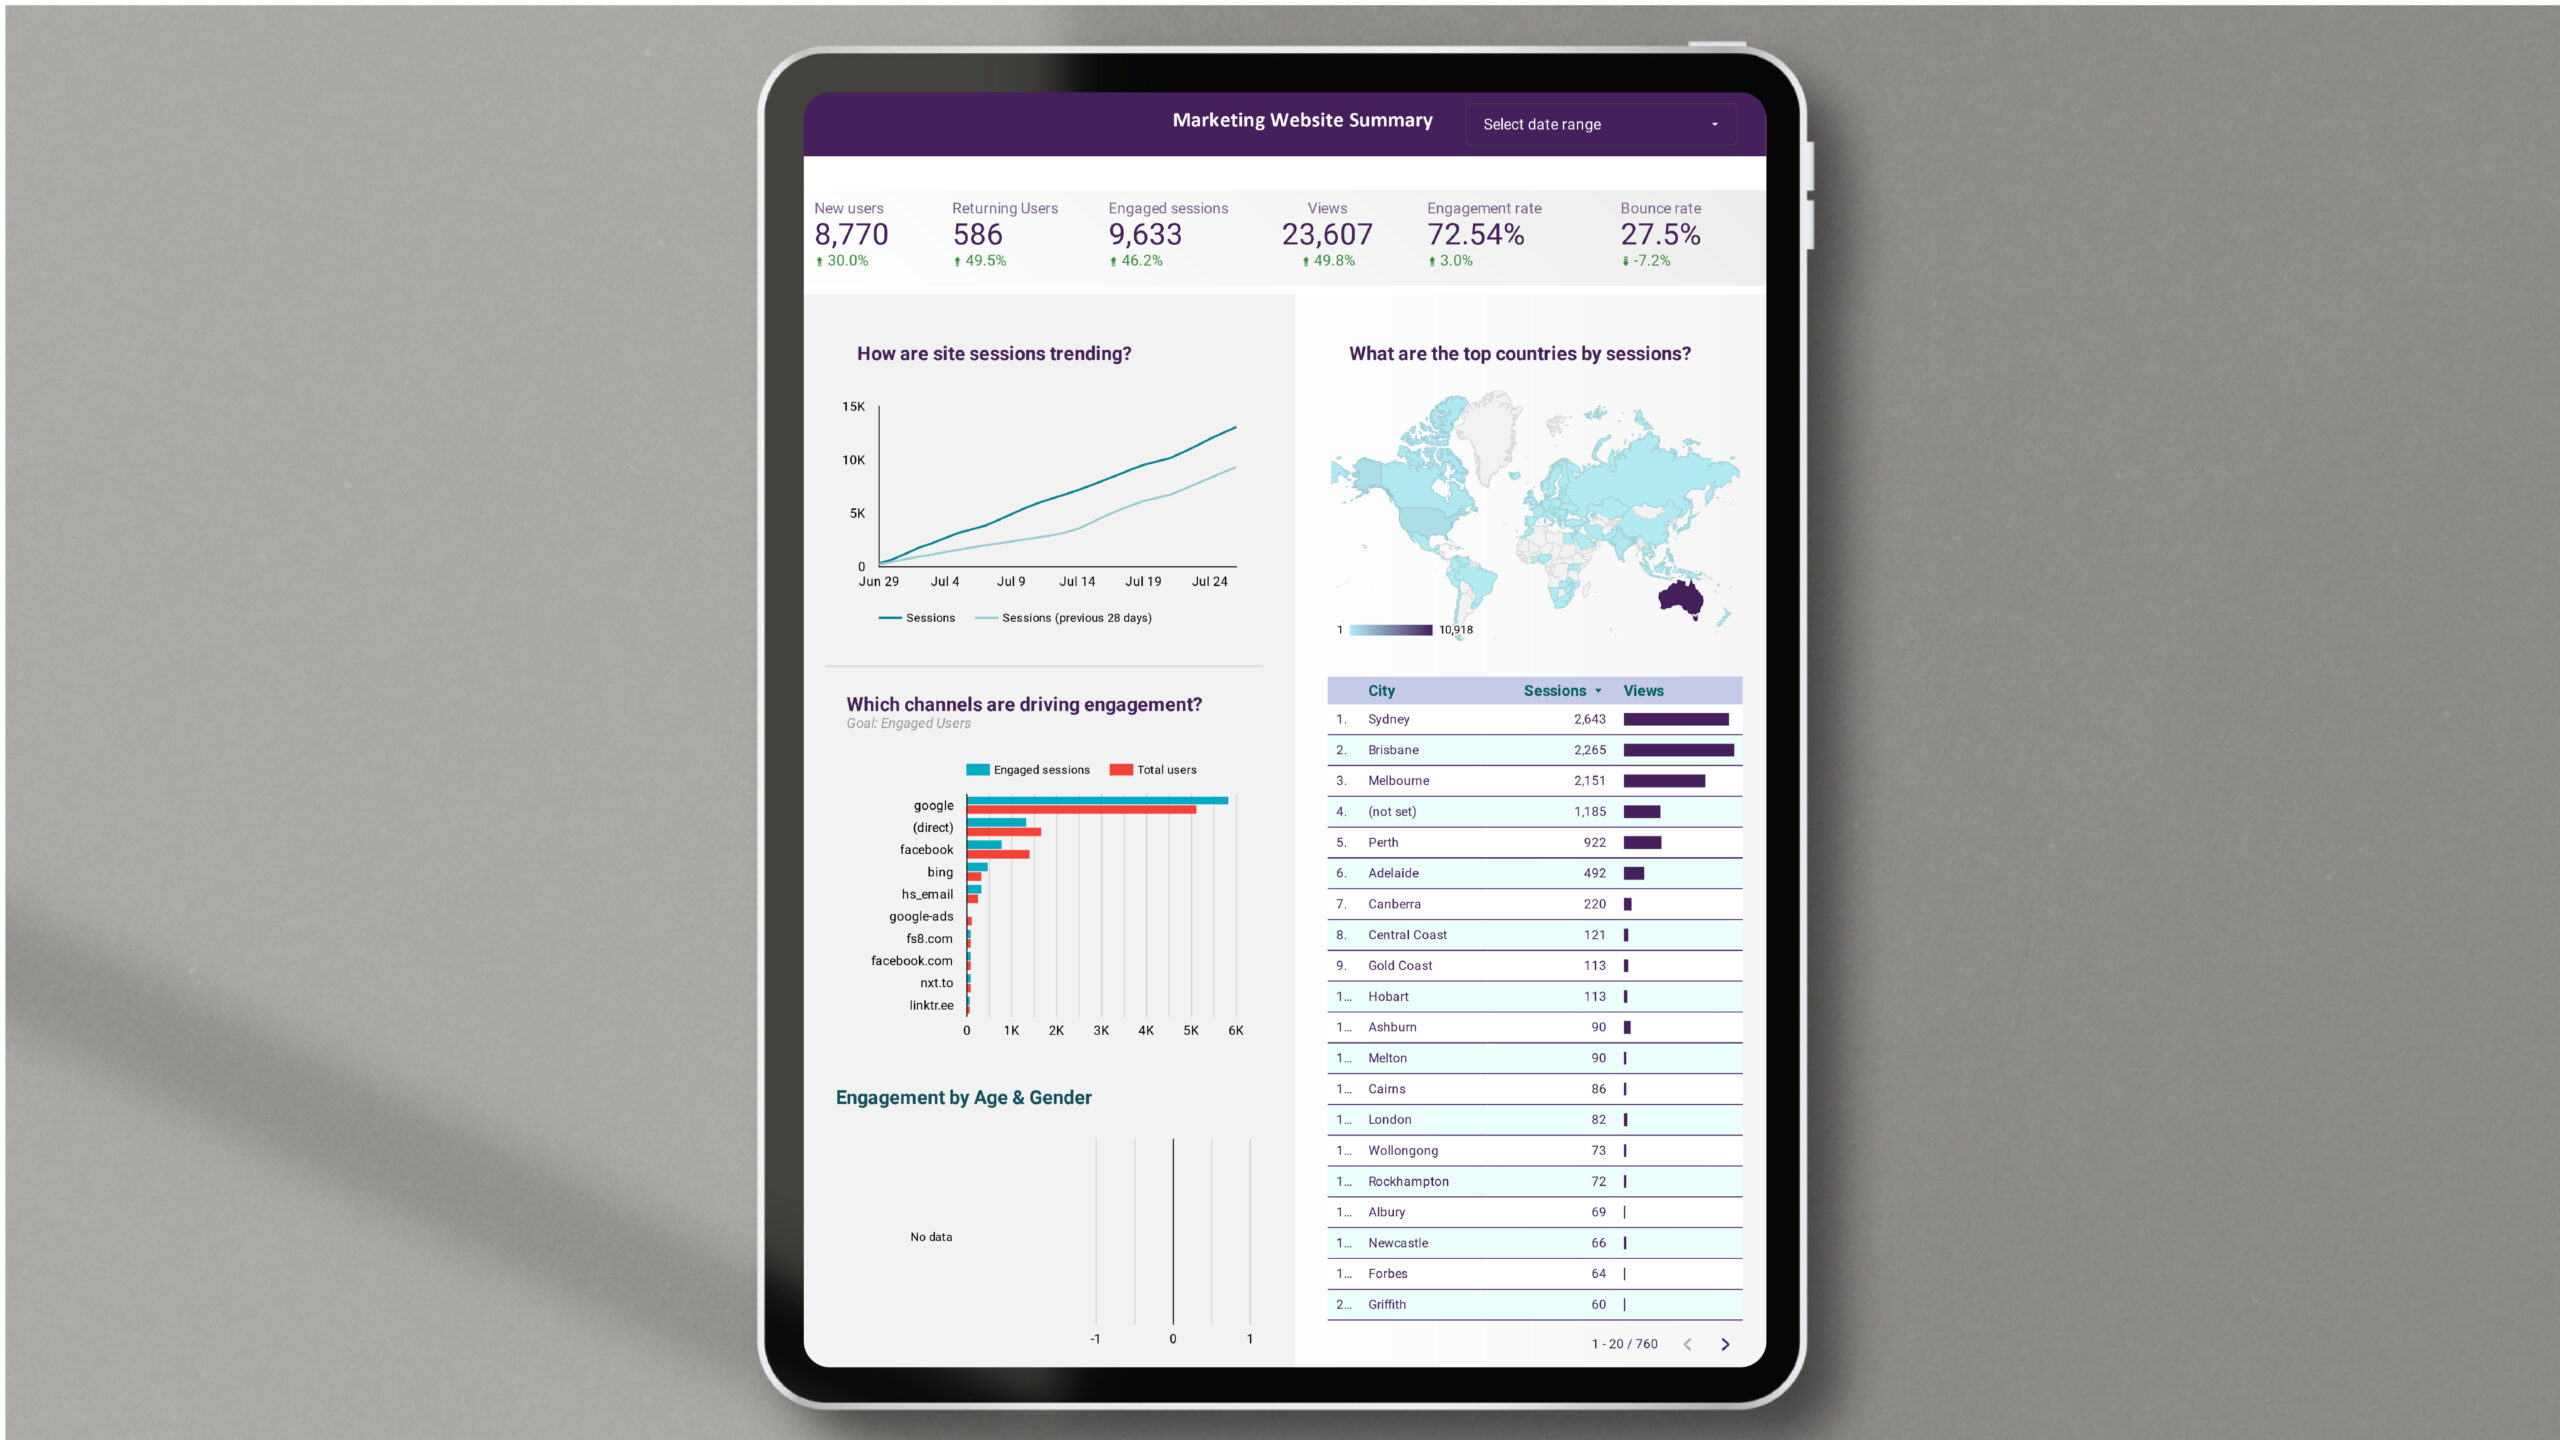
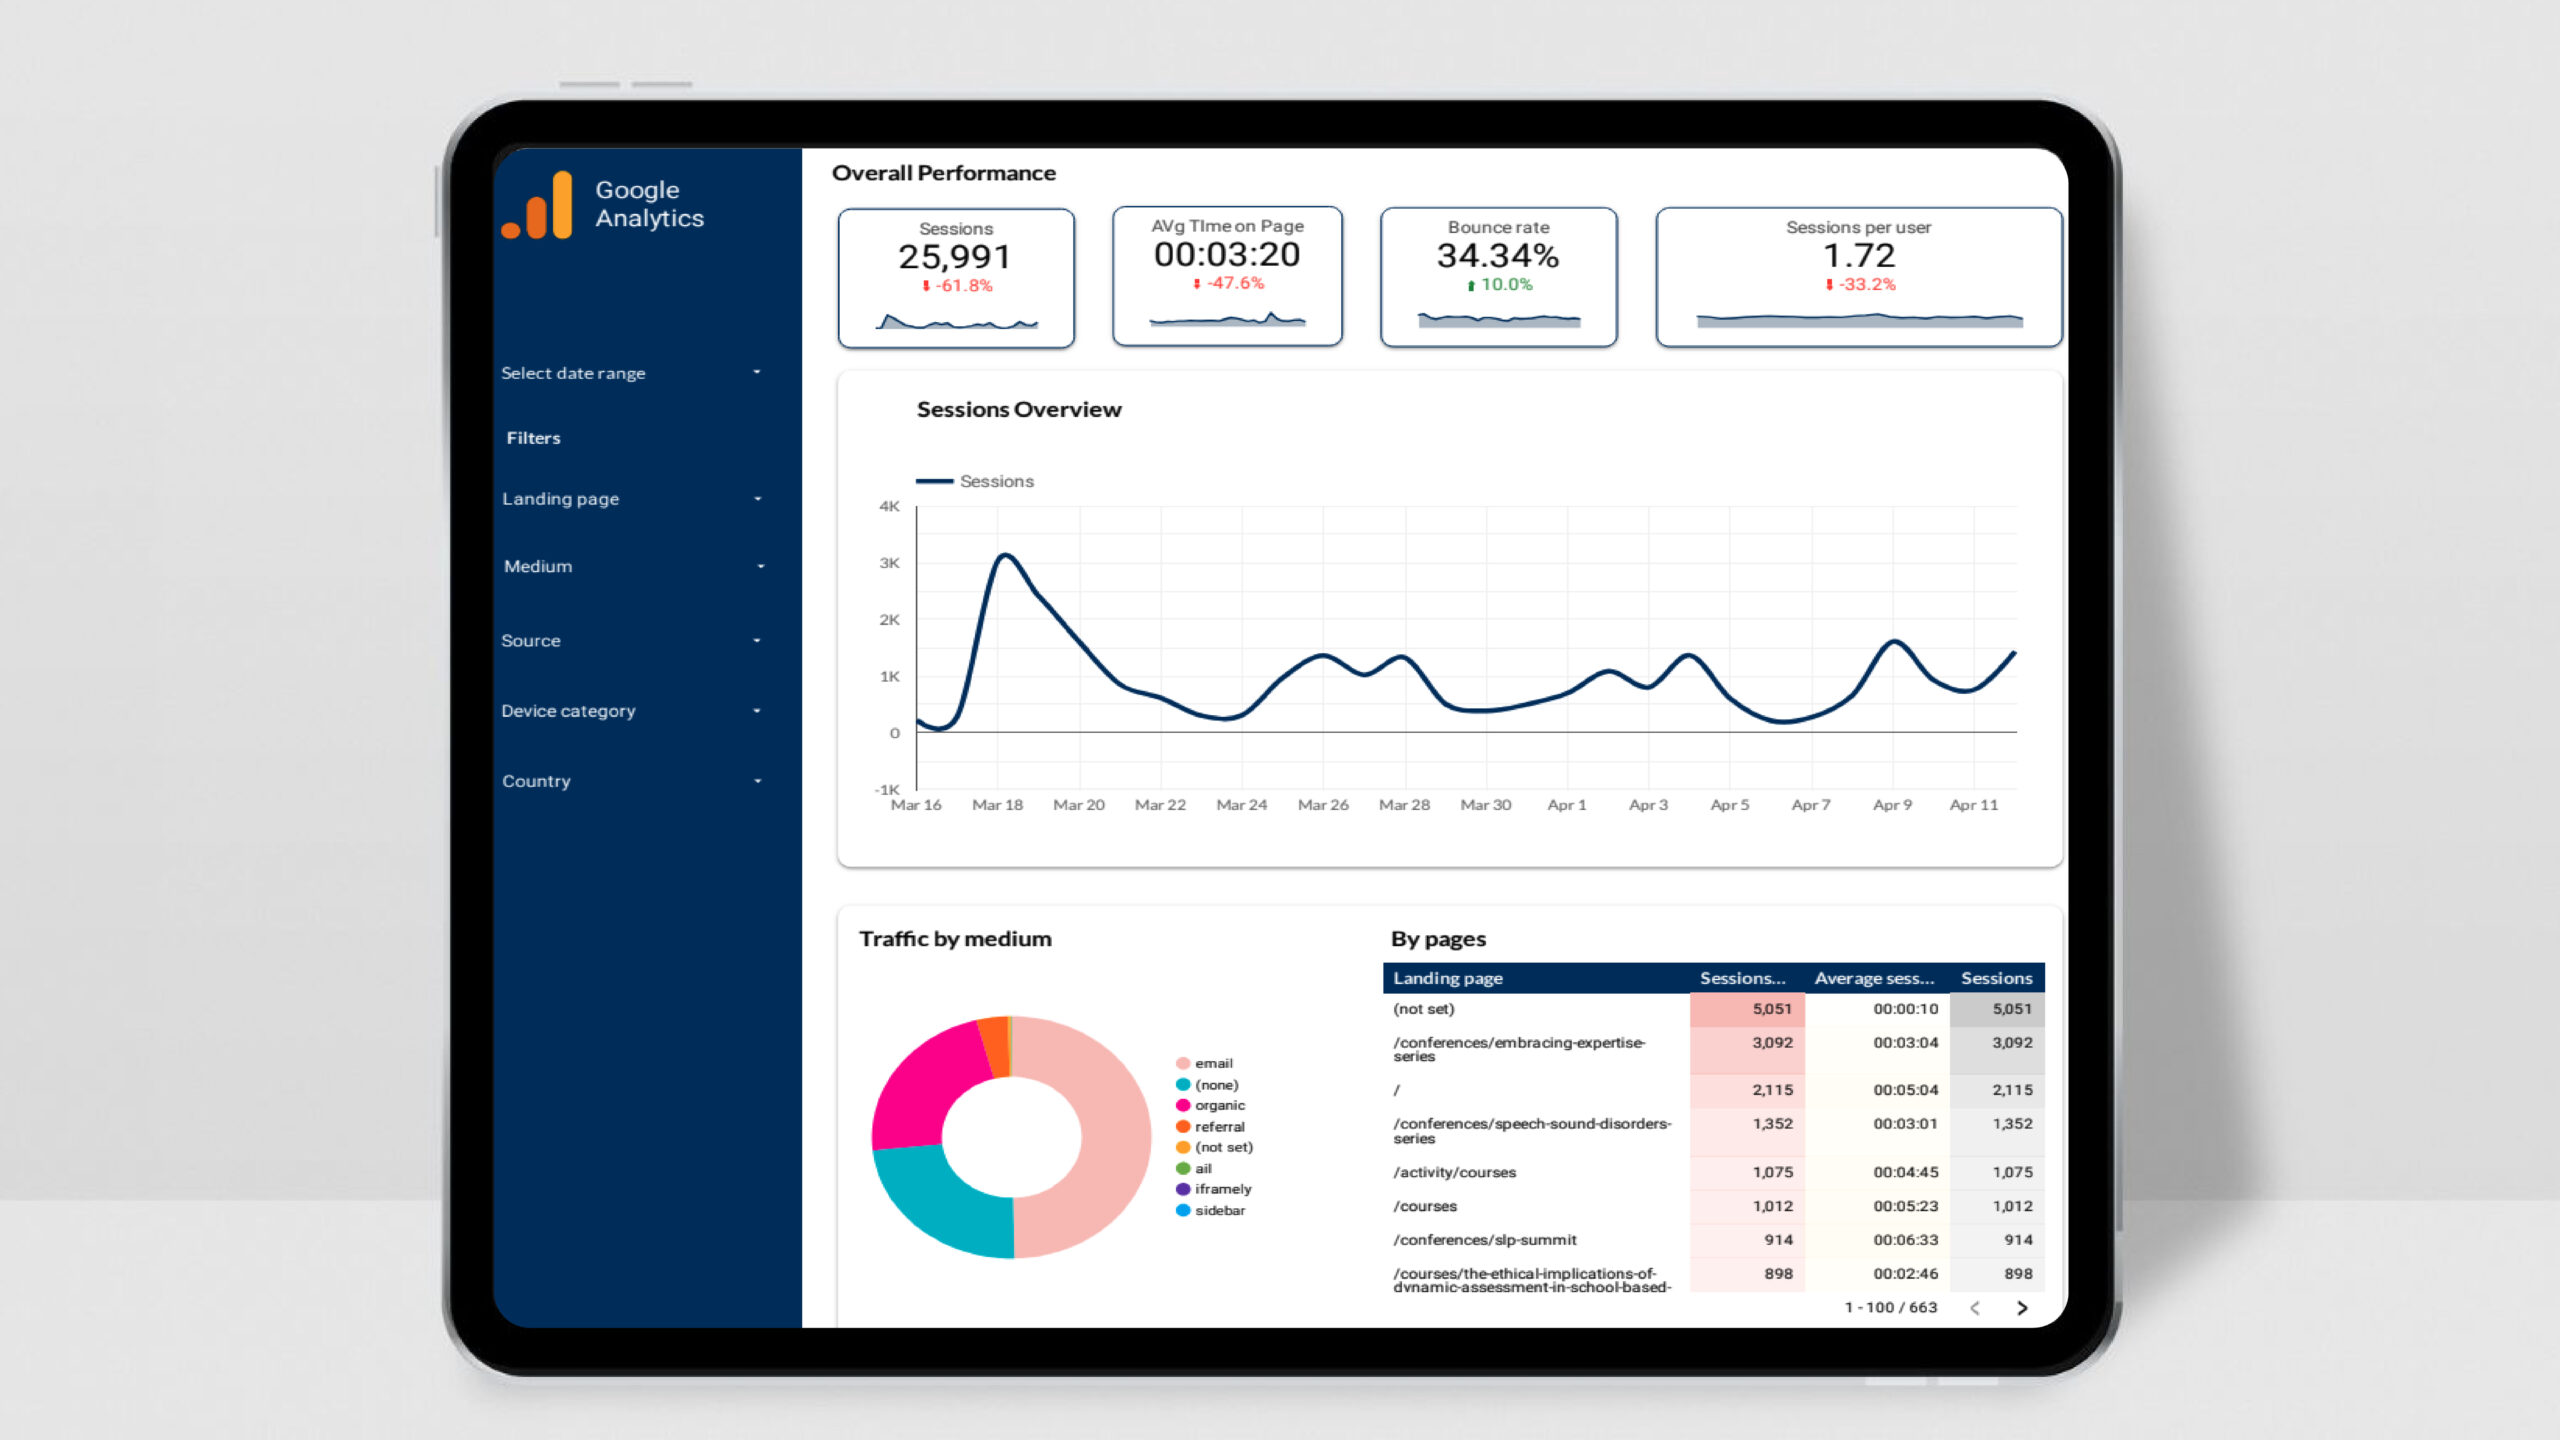
- High-Level Overview: The GA4 Executive View Dashboard offers a bird’s-eye view of your most important metrics, including traffic, conversions, and user behavior. This top-level summary is ideal for executives who need to stay informed without getting bogged down in the details.
- Customizable for Your Needs: Every business is unique, and so are its data needs. Our dashboard is fully customizable, allowing you to focus on the metrics that matter most to your organization. Whether you want to track overall traffic, specific conversion rates, or user engagement, this dashboard can be tailored to suit your requirements.
- Real-Time Insights: In today’s fast-paced business environment, staying up-to-date with the latest data is crucial. The GA4 Executive View Dashboard connects directly to your GA4 property, providing real-time insights that help you stay ahead of the curve.
- Visual Clarity: With its clean, intuitive design, the dashboard makes it easy to understand complex data at a glance. Visualizations such as charts, graphs, and tables are used to present data in a way that is both informative and visually appealing.
- Actionable Intelligence: Beyond just presenting data, the dashboard helps you interpret it. With built-in insights and analysis tools, you can quickly identify trends, spot anomalies, and understand the underlying factors driving your business performance.
Key Features of the Dashboard
- Traffic Overview: Get a snapshot of your website’s traffic, including total users, new users, sessions, and page views. This section helps you understand the overall reach and engagement of your digital presence.
- Conversion Summary: Track your key conversion metrics, such as goal completions, e-commerce transactions, and conversion rates. This feature is essential for measuring the effectiveness of your marketing campaigns and sales strategies.
- User Behavior Insights: Dive into user behavior metrics like average session duration, bounce rate, and pages per session. These insights help you understand how visitors are interacting with your website and identify areas for improvement.
- Acquisition Channels: Analyze where your traffic is coming from, whether it’s organic search, paid ads, social media, or direct visits. Understanding your top-performing channels allows you to allocate resources more effectively.
- Engagement Metrics: Monitor how users are engaging with your content, including events, scroll depth, and video plays. This section helps you gauge the effectiveness of your content strategy and user experience design.
- Revenue and ROI Tracking: For e-commerce businesses, tracking revenue and return on investment (ROI) is crucial. This dashboard provides an at-a-glance view of your revenue performance, along with insights into your highest-performing products and campaigns.
Important KPIs to Track in the GA4 Executive View Dashboard
To ensure you’re getting the most out of your GA4 Executive View Dashboard, it’s important to focus on key performance indicators (KPIs) that reflect your business goals. Here are some essential KPIs this dashboard will help you track:
- Total Users: The number of unique visitors to your website. This KPI is crucial for understanding the reach of your digital presence.
- New Users: The count of first-time visitors to your site. Monitoring this metric helps you gauge the effectiveness of your outreach and marketing efforts.
- Sessions: The total number of sessions initiated by users. This KPI provides insights into user engagement and the frequency of visits.
- Conversion Rate: The percentage of users who complete a desired action, such as making a purchase or signing up for a newsletter. This KPI is vital for measuring the effectiveness of your website’s calls to action.
- Average Session Duration: The average amount of time users spend on your site during a session. This metric helps you understand how engaging and valuable your content is.
- Bounce Rate: The percentage of single-page sessions where the user left without interacting with the page. A high bounce rate may indicate issues with your site’s content, design, or user experience.
- Goal Completions: The total number of times a specific goal was completed, such as a form submission or product purchase. This KPI is critical for tracking the success of your website’s objectives.
- Revenue: For e-commerce businesses, tracking total revenue generated is essential for understanding your financial performance.
- Return on Investment (ROI): The return on your marketing and advertising spend. This KPI helps you assess the profitability of your campaigns and allocate your budget more effectively.
- Top Acquisition Channels: Understanding which channels drive the most traffic and conversions helps you optimize your marketing strategy for better results.
Who Should Use This Dashboard?
The GA4 Executive View Dashboard is ideal for:
- Business Executives: Get a quick, high-level overview of your company’s digital performance without getting lost in the details.
- Marketing Directors: Monitor the effectiveness of your marketing campaigns and make data-driven decisions to improve ROI.
- E-commerce Managers: Track key e-commerce metrics, including revenue and conversions, to ensure your online store is performing optimally.
- Digital Analysts: Analyze and report on key performance metrics to provide actionable insights to stakeholders.
How to Get Started
Take your business to the next level with the GA4 Executive View Dashboard in Looker Studio. Purchase the dashboard today and start gaining valuable insights into your website’s performance.
Simply visit our Product Section to buy the dashboard. Once purchased, you’ll receive detailed instructions on how to connect your GA4 property to Looker Studio, allowing you to start analyzing your data immediately.
Conclusion
In today’s data-driven world, having quick access to essential metrics is key to making informed decisions that drive business growth. The GA4 Executive View Dashboard in Looker Studio provides the insights you need to stay ahead of the competition and optimize your digital strategy.
Don’t wait—purchase the dashboard today and start transforming your data into strategic insights.


