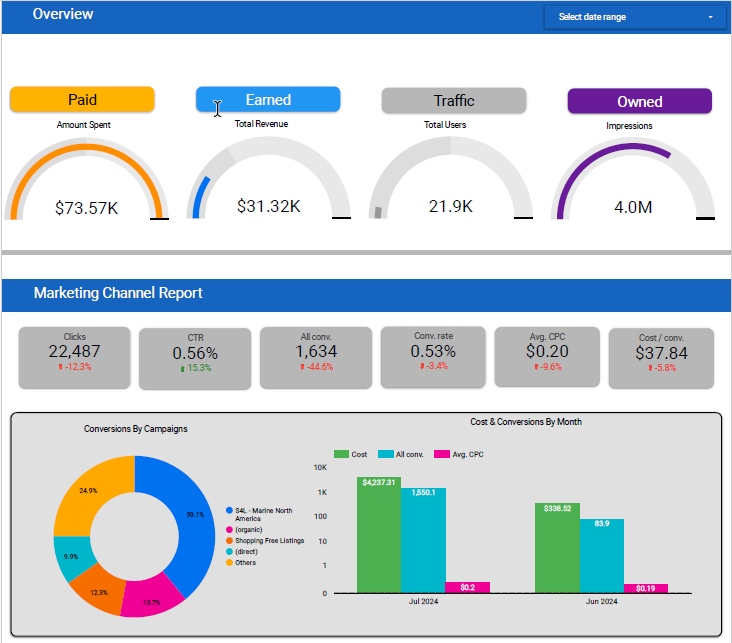
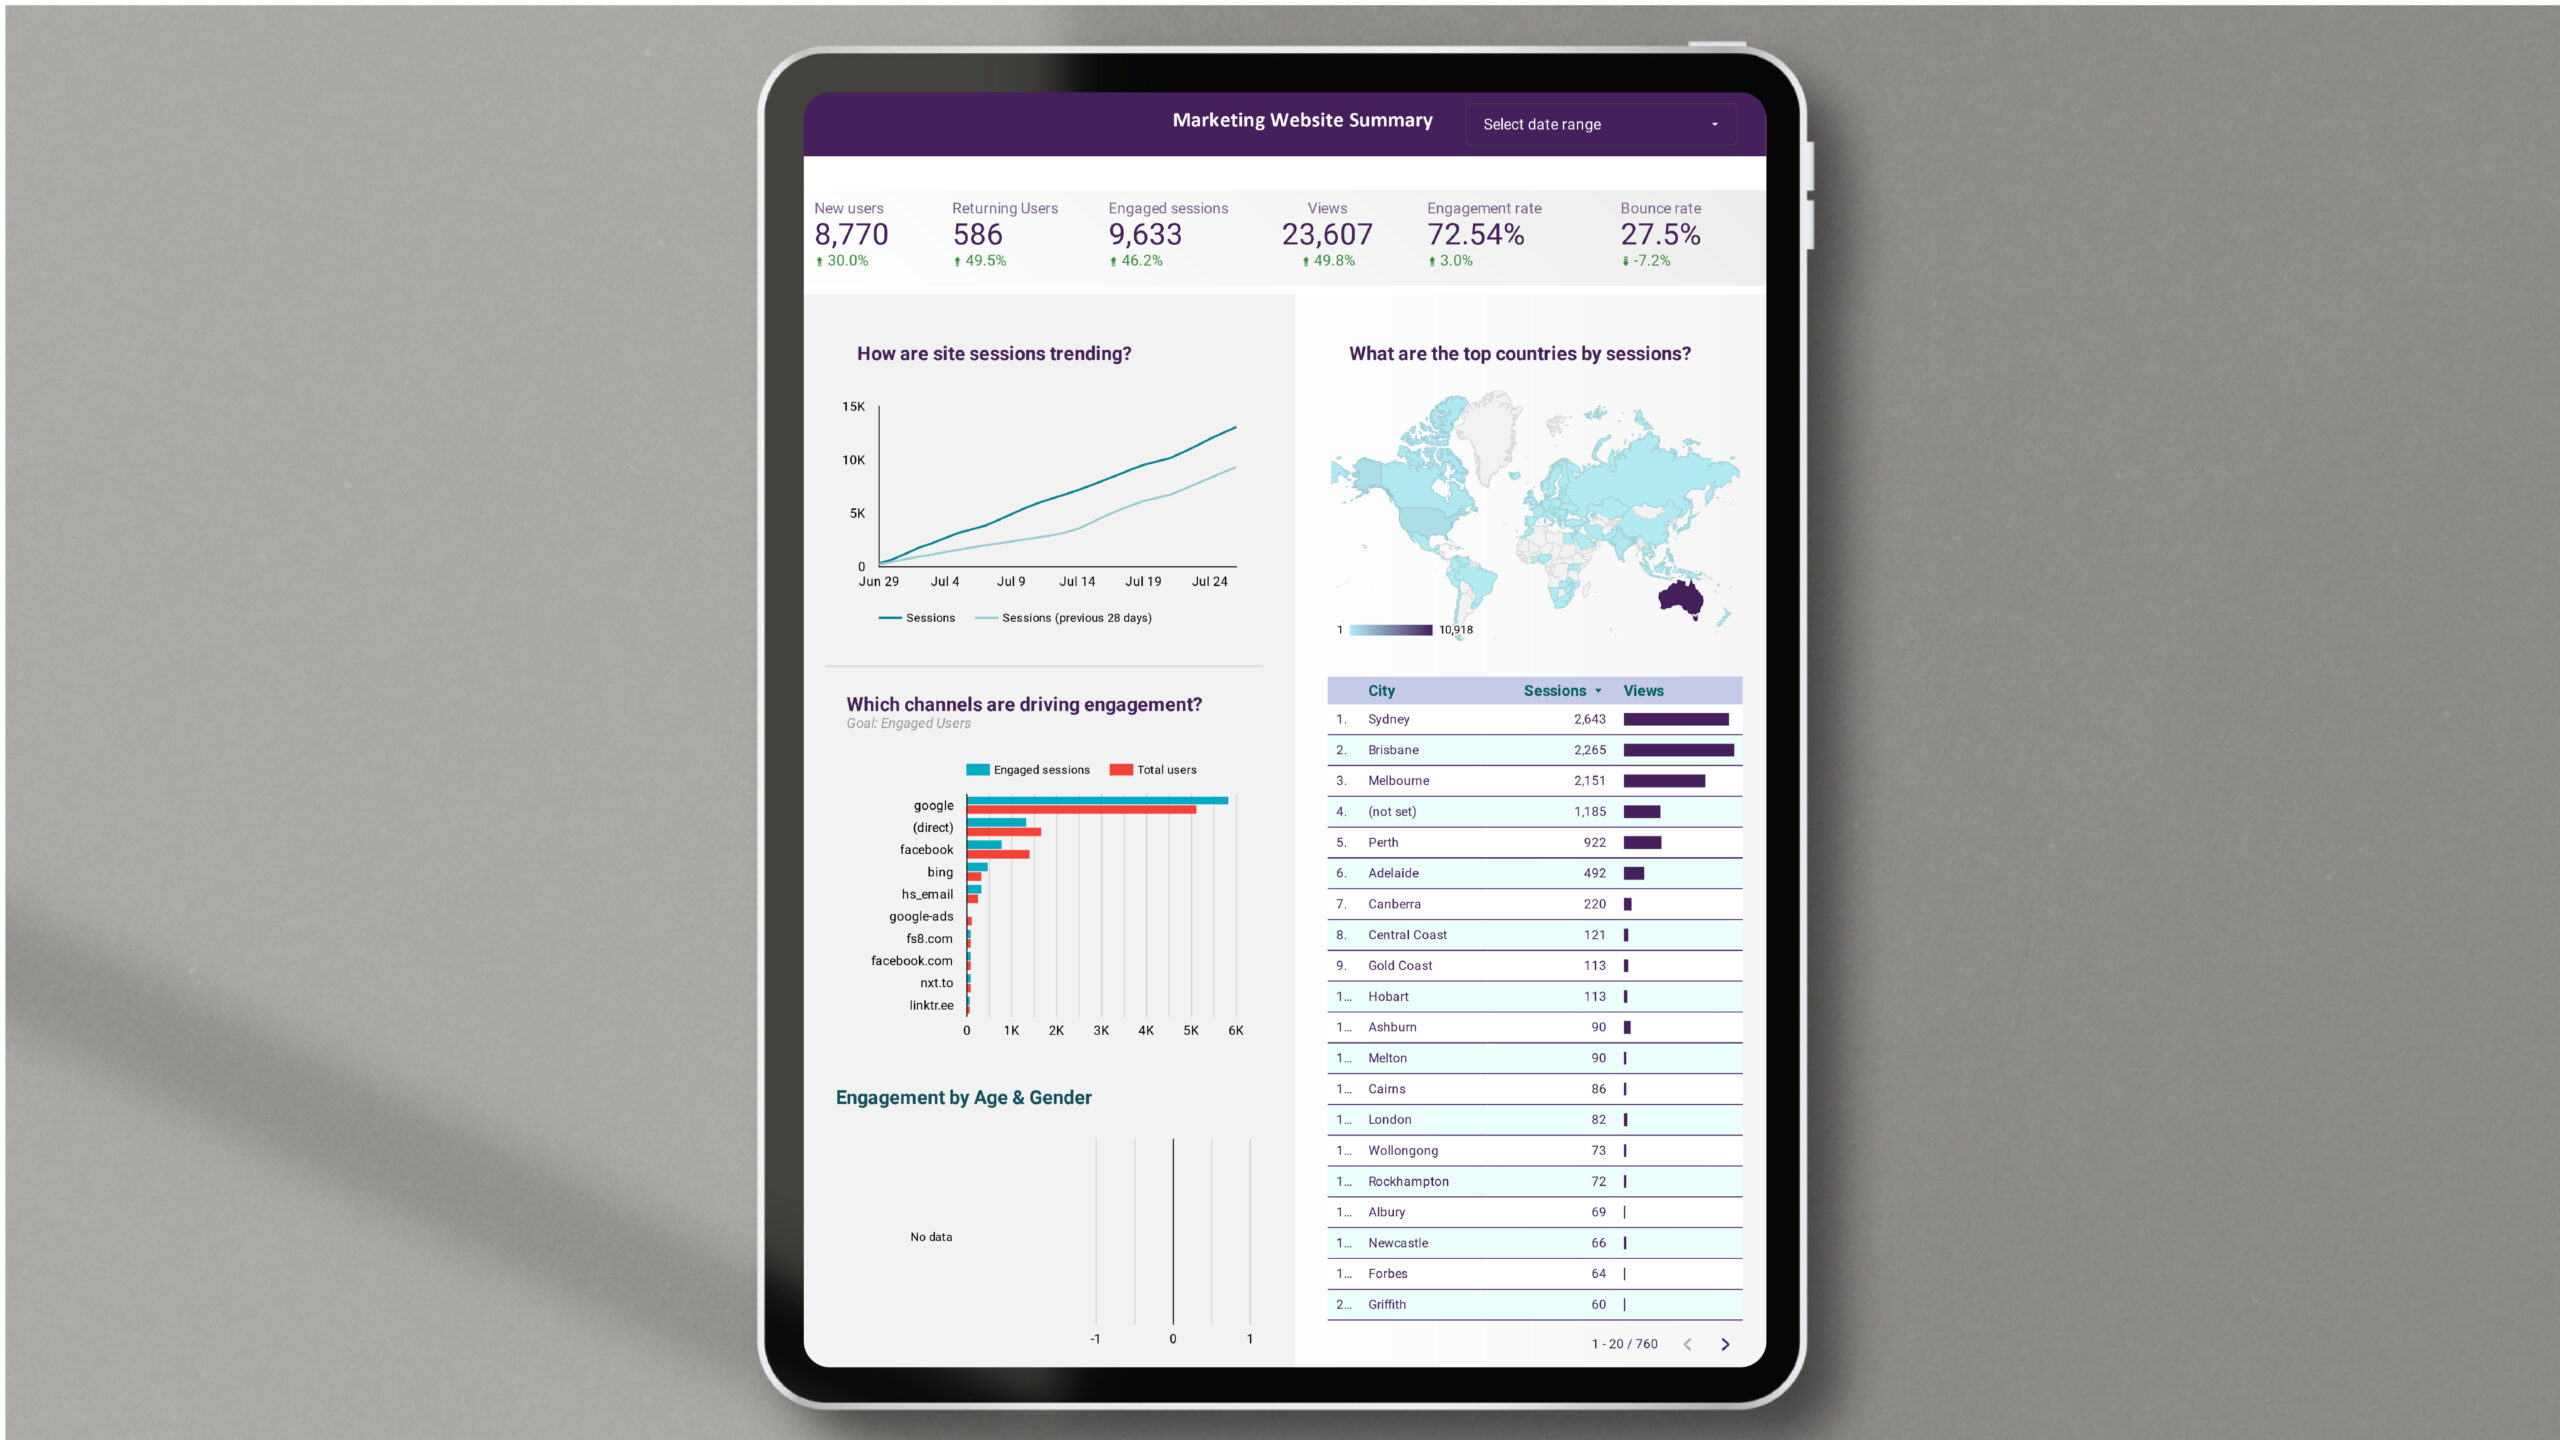
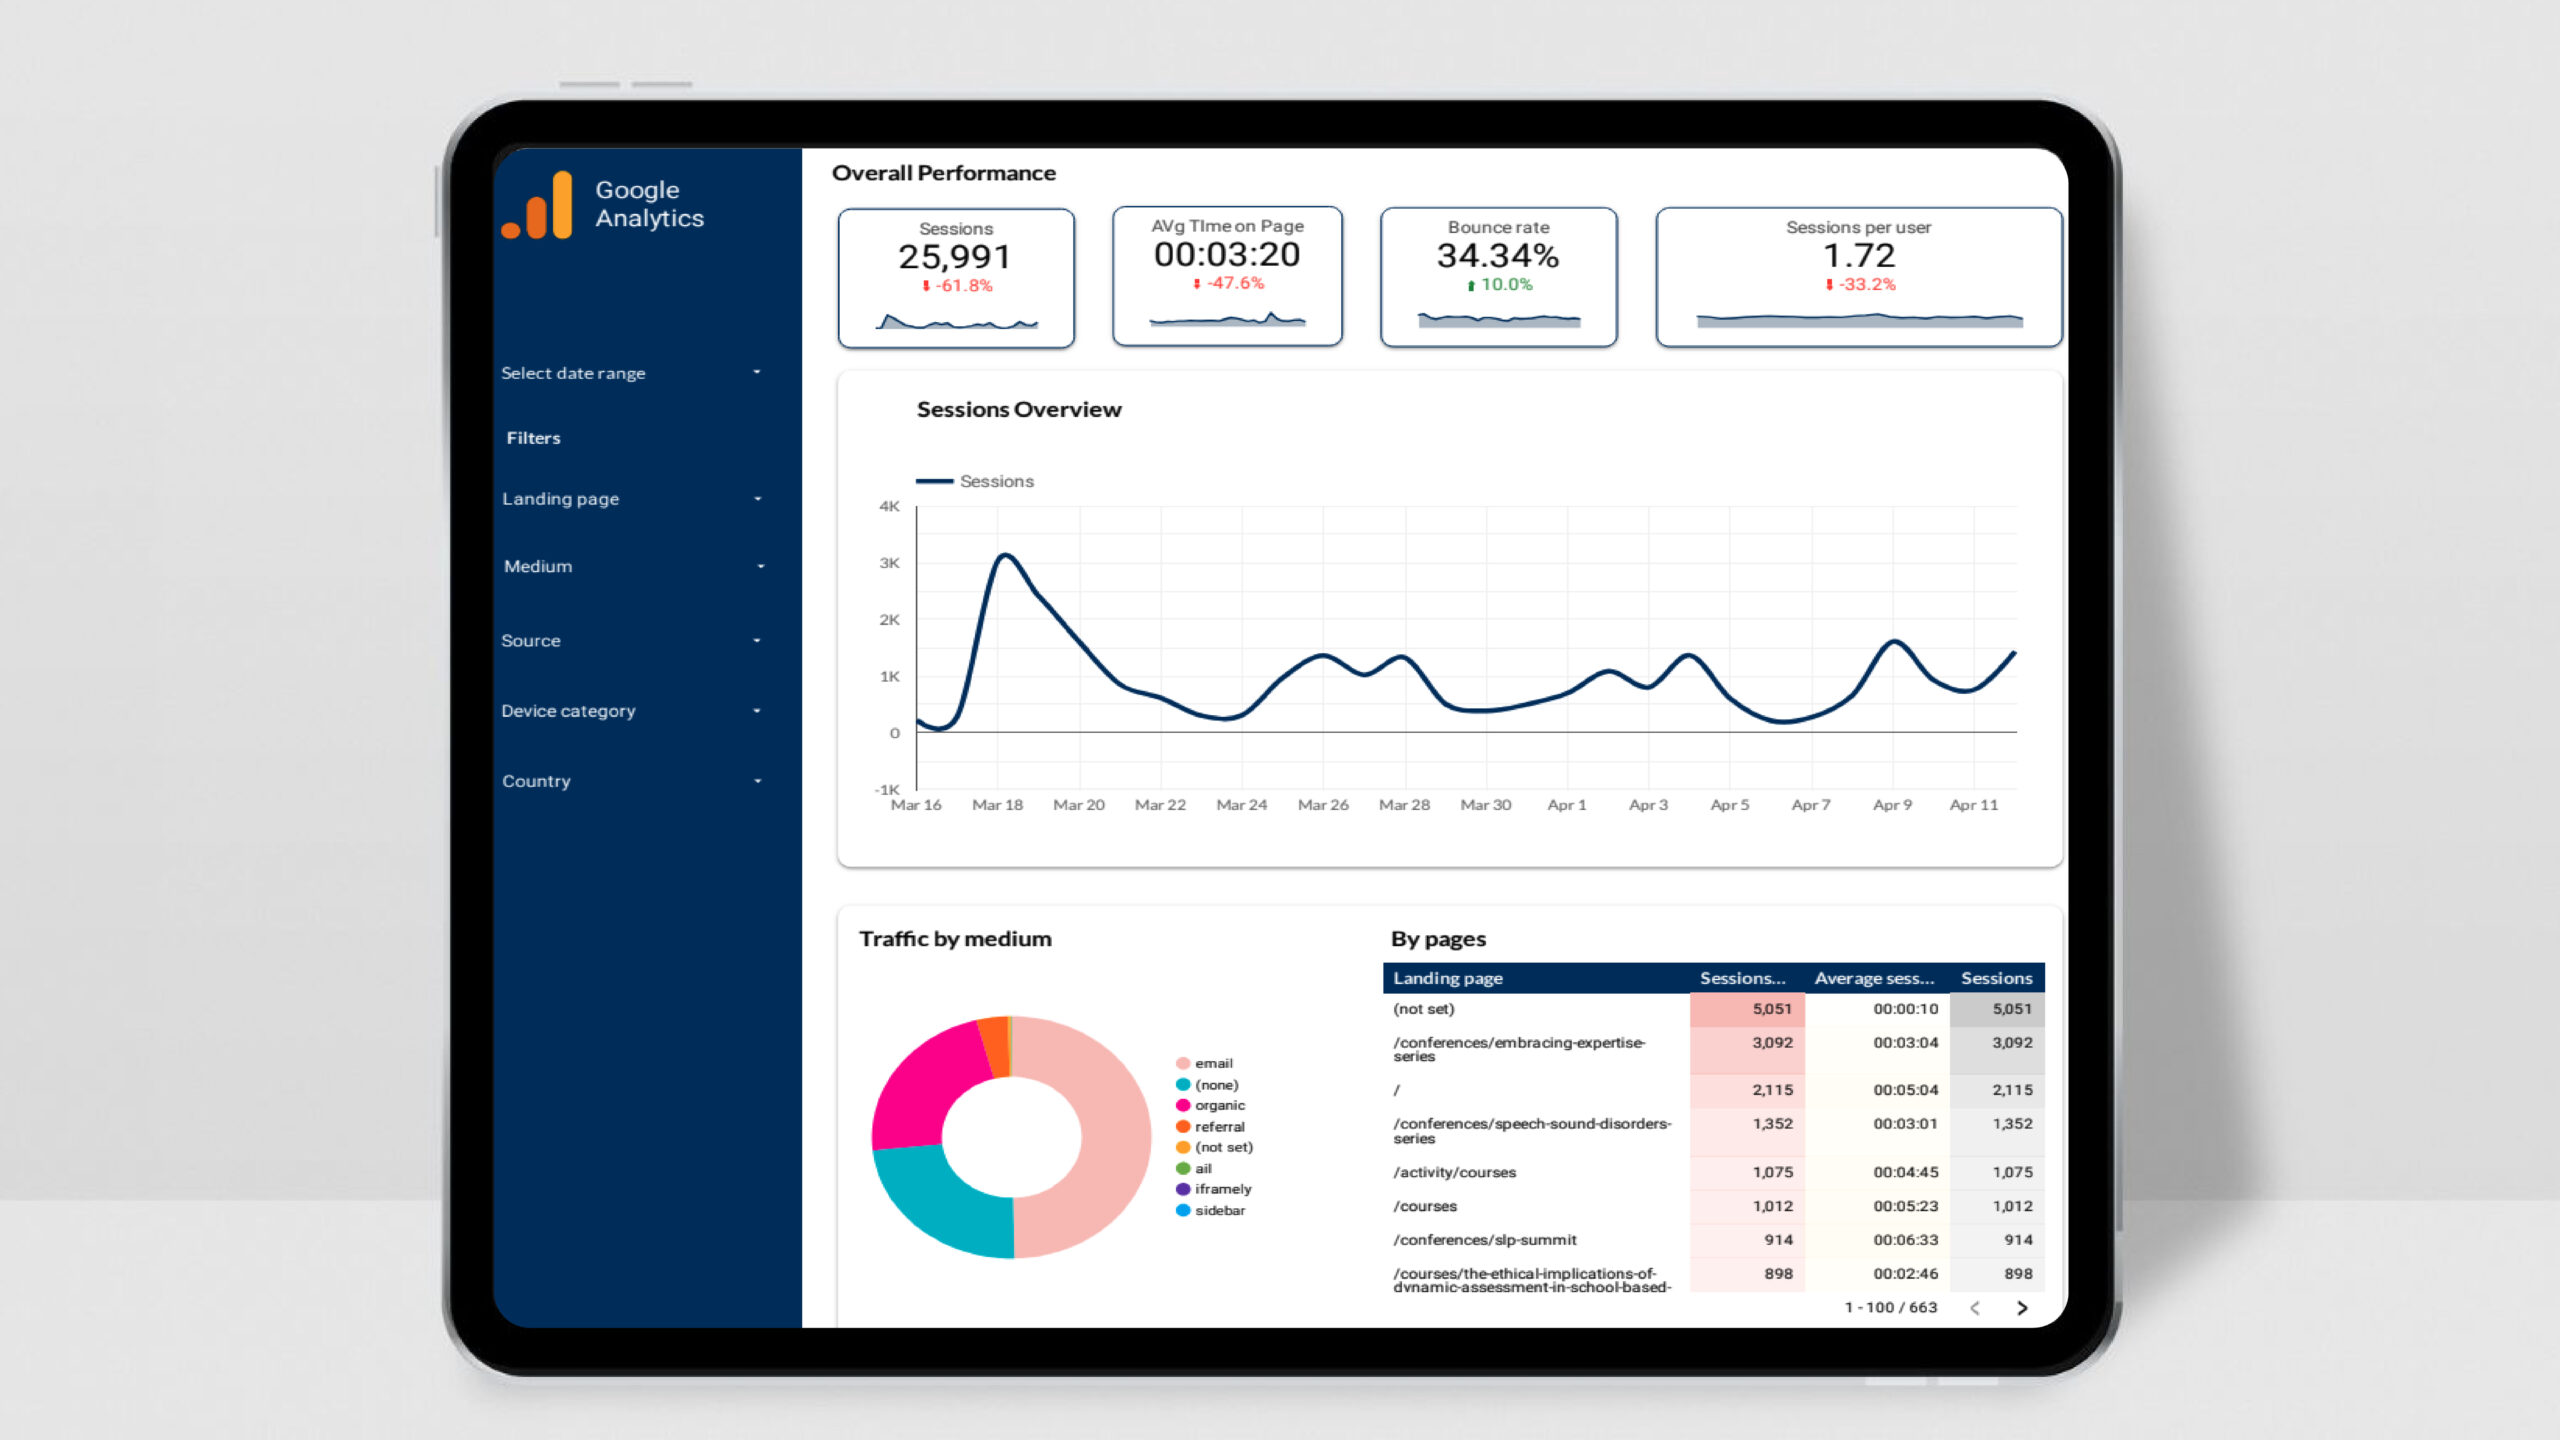
Optimize your ad strategy with our Google Ads Scorecard Report Template in Looker Studio. This tool delivers essential insights into ad spend, click-through rates, conversions, and ROI, empowering you to make data-driven decisions with ease.
Key Features:
- Campaign Overview: Track ad spend, clicks, impressions, and conversions to identify top-performing campaigns and adjust as needed.
- Audience Insights: Analyze demographic and geographic data to refine targeting for higher engagement.
- Conversion Tracking: See conversion rates and ROI by campaign, keyword, and placement for better budget allocation.
- Cost Analysis: Monitor CPC, CPA, and ROAS to maximize your ad spend efficiency.
List of Key Performance Indicators (KPIs) in the Dashboard:
- Ad Spend
- Clicks
- Impressions
- Click-Through Rate (CTR)
- Conversions
- Conversion Rate
- Cost Per Click (CPC)
- Cost Per Acquisition (CPA)
- Return on Ad Spend (ROAS)
- Demographic Reach
- Geographic Reach
- Device Type Performance
Practical Use Cases:
- Optimize Campaigns: Use performance metrics to identify high-performing ads, spot trends, and make quick adjustments to improve click-through rates and conversion rates.
- Refine Targeting: With audience insights, refine your targeting to focus on the most engaged demographics and geographic areas for maximum ad relevance and effectiveness.
- Maximize ROI: Track and compare cost efficiency metrics, allocating your budget to the campaigns with the highest returns and making data-driven decisions for sustainable growth.
Benefits:
- Quick Setup: Start visualizing your Google Ads data in minutes.
- Customizable Views: Focus on metrics that matter to your team.
- Easy Sharing: Seamlessly share insights with stakeholders.
Elevate your ad performance with real-time, actionable insights using this Google Ads Dashboard.


