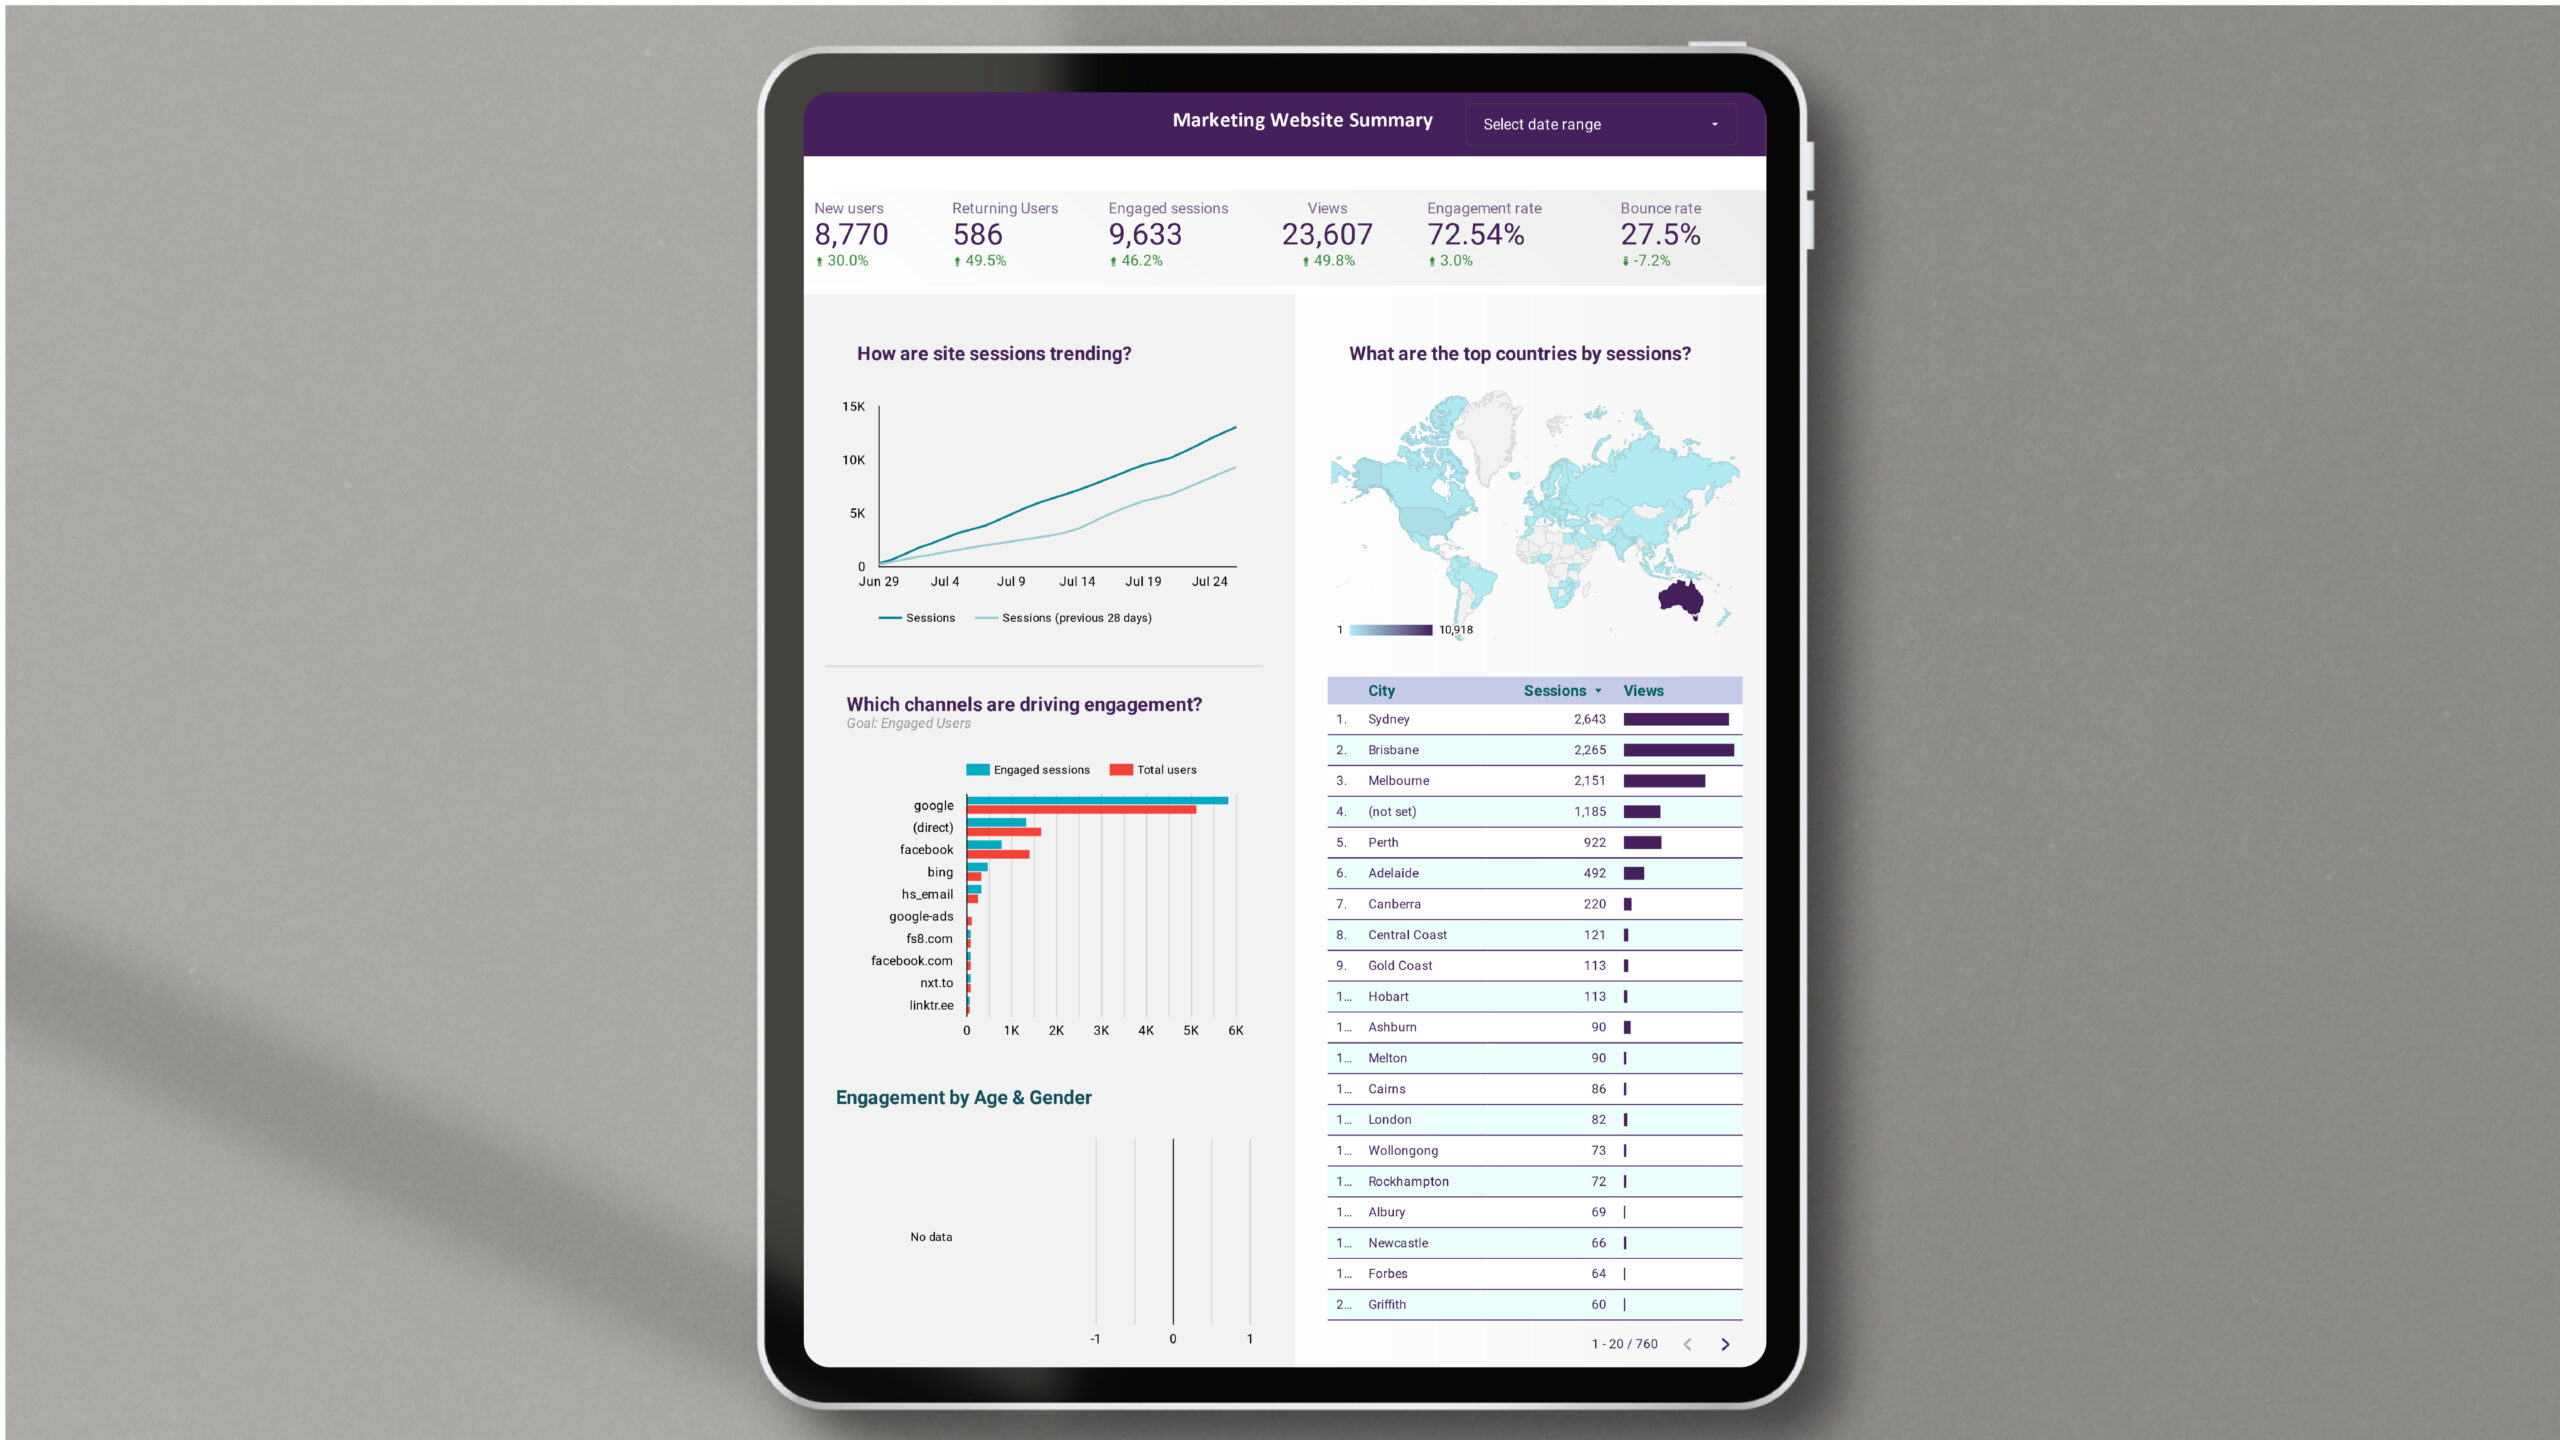
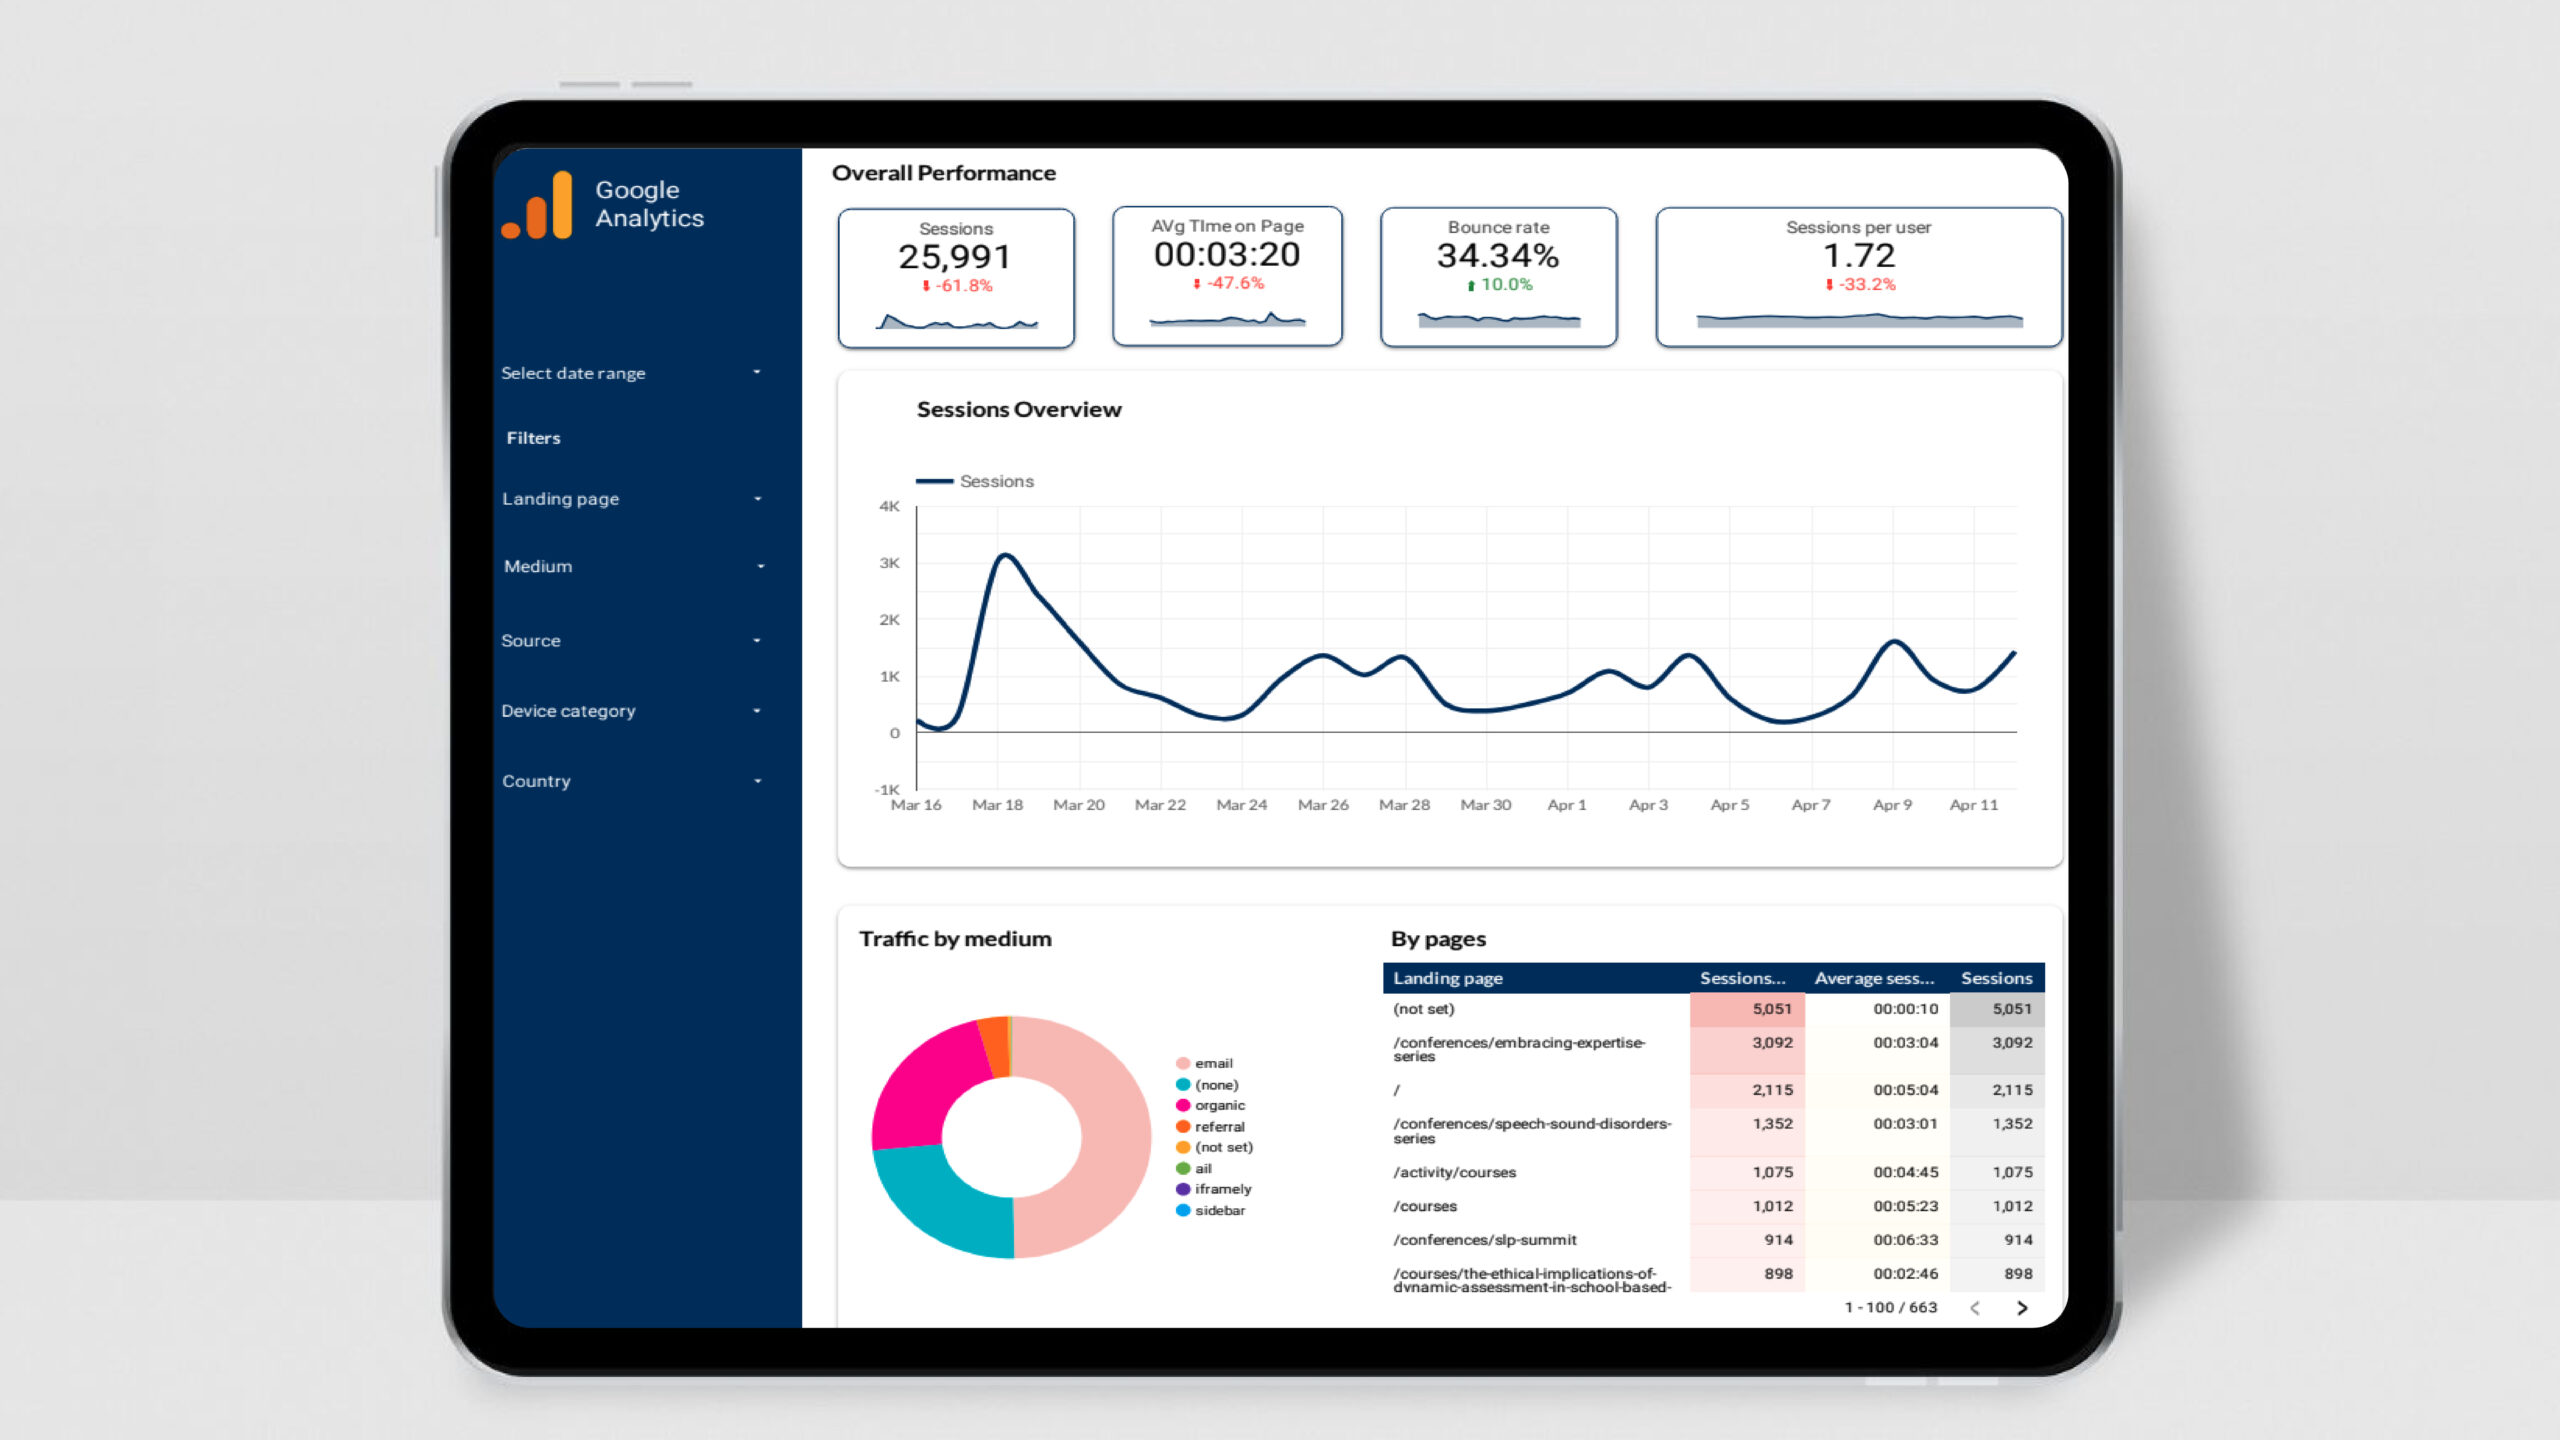
What is the Website Marketing Summary Dashboard?
The Website Marketing Summary Dashboard in Looker Studio is a comprehensive reporting tool that consolidates important KPIs into a user-friendly, visual format. It integrates with Google Analytics, Google Ads, and other marketing platforms to give you a full picture of how your website is performing across different channels.
With the dashboard, you can track the effectiveness of your SEO, paid ads, social media campaigns, and content marketing efforts—all in one place. This saves time and provides clear insights into which areas of your marketing strategy are performing well and which ones need improvement.
Why Use the Website Marketing Summary Dashboard in Looker Studio?
Here are a few reasons why the Website Marketing Summary Dashboard is an essential tool for marketers:
- Comprehensive Overview: Get a high-level snapshot of your website’s overall performance without digging through multiple reports.
- Customizable Metrics: Tailor the dashboard to include the metrics that matter most to your marketing goals.
- Real-Time Data: With real-time updates from Google Analytics and other platforms, you always have access to the most current data.
- Simplified Reporting: Save time with automated reporting, reducing the need for manual data collection and analysis.
- Actionable Insights: Identify strengths, weaknesses, and opportunities in your marketing strategy through clear, visualized data.
Key Metrics to Track in the Website Marketing Summary Dashboard
The Website Marketing Summary Dashboard focuses on the key metrics that are most important for understanding your website’s marketing performance. Here’s a breakdown of some critical KPIs that can be tracked:
1. Website Traffic
- Total Sessions
- Traffic by Source (Organic, Paid, Direct, Referral, Social)
- New vs Returning Users
- Users by Location
2. User Engagement
- Bounce Rate
- Average Session Duration
- Pages per Session
- Top Performing Pages
3. Conversions
- Total Conversions
- Conversion Rate
- Goal Completions (Form Submissions, Signups, etc.)
- E-commerce Conversions (if applicable)
4. Traffic Sources
- Organic Traffic (SEO Performance)
- Paid Traffic (Google Ads, Facebook Ads, etc.)
- Social Media Traffic (Facebook, Twitter, Instagram, etc.)
- Referral Traffic
5. SEO Performance
- Organic Keywords Driving Traffic
- Top Landing Pages from Organic Search
- Click-through Rate (CTR) from Search Engines
- Impressions and Clicks from Google Search Console
6. Paid Campaign Performance
- Total Ad Spend
- Cost per Conversion
- Click-through Rate (CTR) for Ads
- Return on Ad Spend (ROAS)
7. Social Media Engagement
- Traffic from Social Platforms
- Social Conversions
- Top Performing Posts/Content
- Engagement Metrics (Likes, Shares, Comments)
8. Content Marketing Insights
- Top Blog Posts by Traffic
- Average Time on Page for Key Content
- Content Shares and Engagement
- Traffic from Content Marketing Efforts
Benefits of the Website Marketing Summary Dashboard
1. Holistic View of Marketing Performance
The dashboard gives you a comprehensive overview of your marketing efforts, allowing you to see how different channels contribute to your overall success. This makes it easier to allocate resources effectively and focus on the tactics that drive results.
2. Data-Driven Decision Making
With real-time data at your fingertips, you can quickly identify areas that need attention. Whether it’s adjusting your SEO strategy or increasing your ad spend, the Website Marketing Summary Dashboard provides actionable insights that lead to better decisions.
3. Streamlined Reporting
Instead of managing separate reports for different platforms, this dashboard consolidates all your marketing data in one place. This simplifies reporting and saves time, making it easier to communicate key performance metrics to stakeholders or team members.
4. Customizable to Your Needs
Every business has different marketing goals, and this dashboard can be tailored to meet your specific needs. Whether you’re focused on increasing traffic, boosting conversions, or improving engagement, you can customize the dashboard to highlight the metrics that matter most to your business.
5. Real-Time Insights
Looker Studio integrates with Google Analytics, Ads, and other platforms to provide real-time data, ensuring you’re always up to date with the latest information. This allows for quick adjustments to your marketing strategy, helping you stay agile in a competitive digital landscape.
How to Get the Website Marketing Summary Dashboard
Ready to gain full visibility into your website’s marketing performance? You can purchase the Website Marketing Summary Dashboard for Looker Studio on our website. This fully customizable template allows you to visualize key marketing metrics and gain actionable insights into your online presence.
Conclusion
The Website Marketing Summary Dashboard in Looker Studio provides a streamlined, comprehensive view of your digital marketing performance. By tracking key metrics such as traffic, conversions, and engagement across various channels, this dashboard enables you to make informed, data-driven decisions that improve your marketing strategy. Whether you’re running an e-commerce site, a content-driven blog, or a service-based business, this tool is designed to help you optimize your online efforts and drive growth.
Invest in the Website Marketing Summary Dashboard today to start turning data into success!


