What is the Website Performance Dashboard by Device Category?
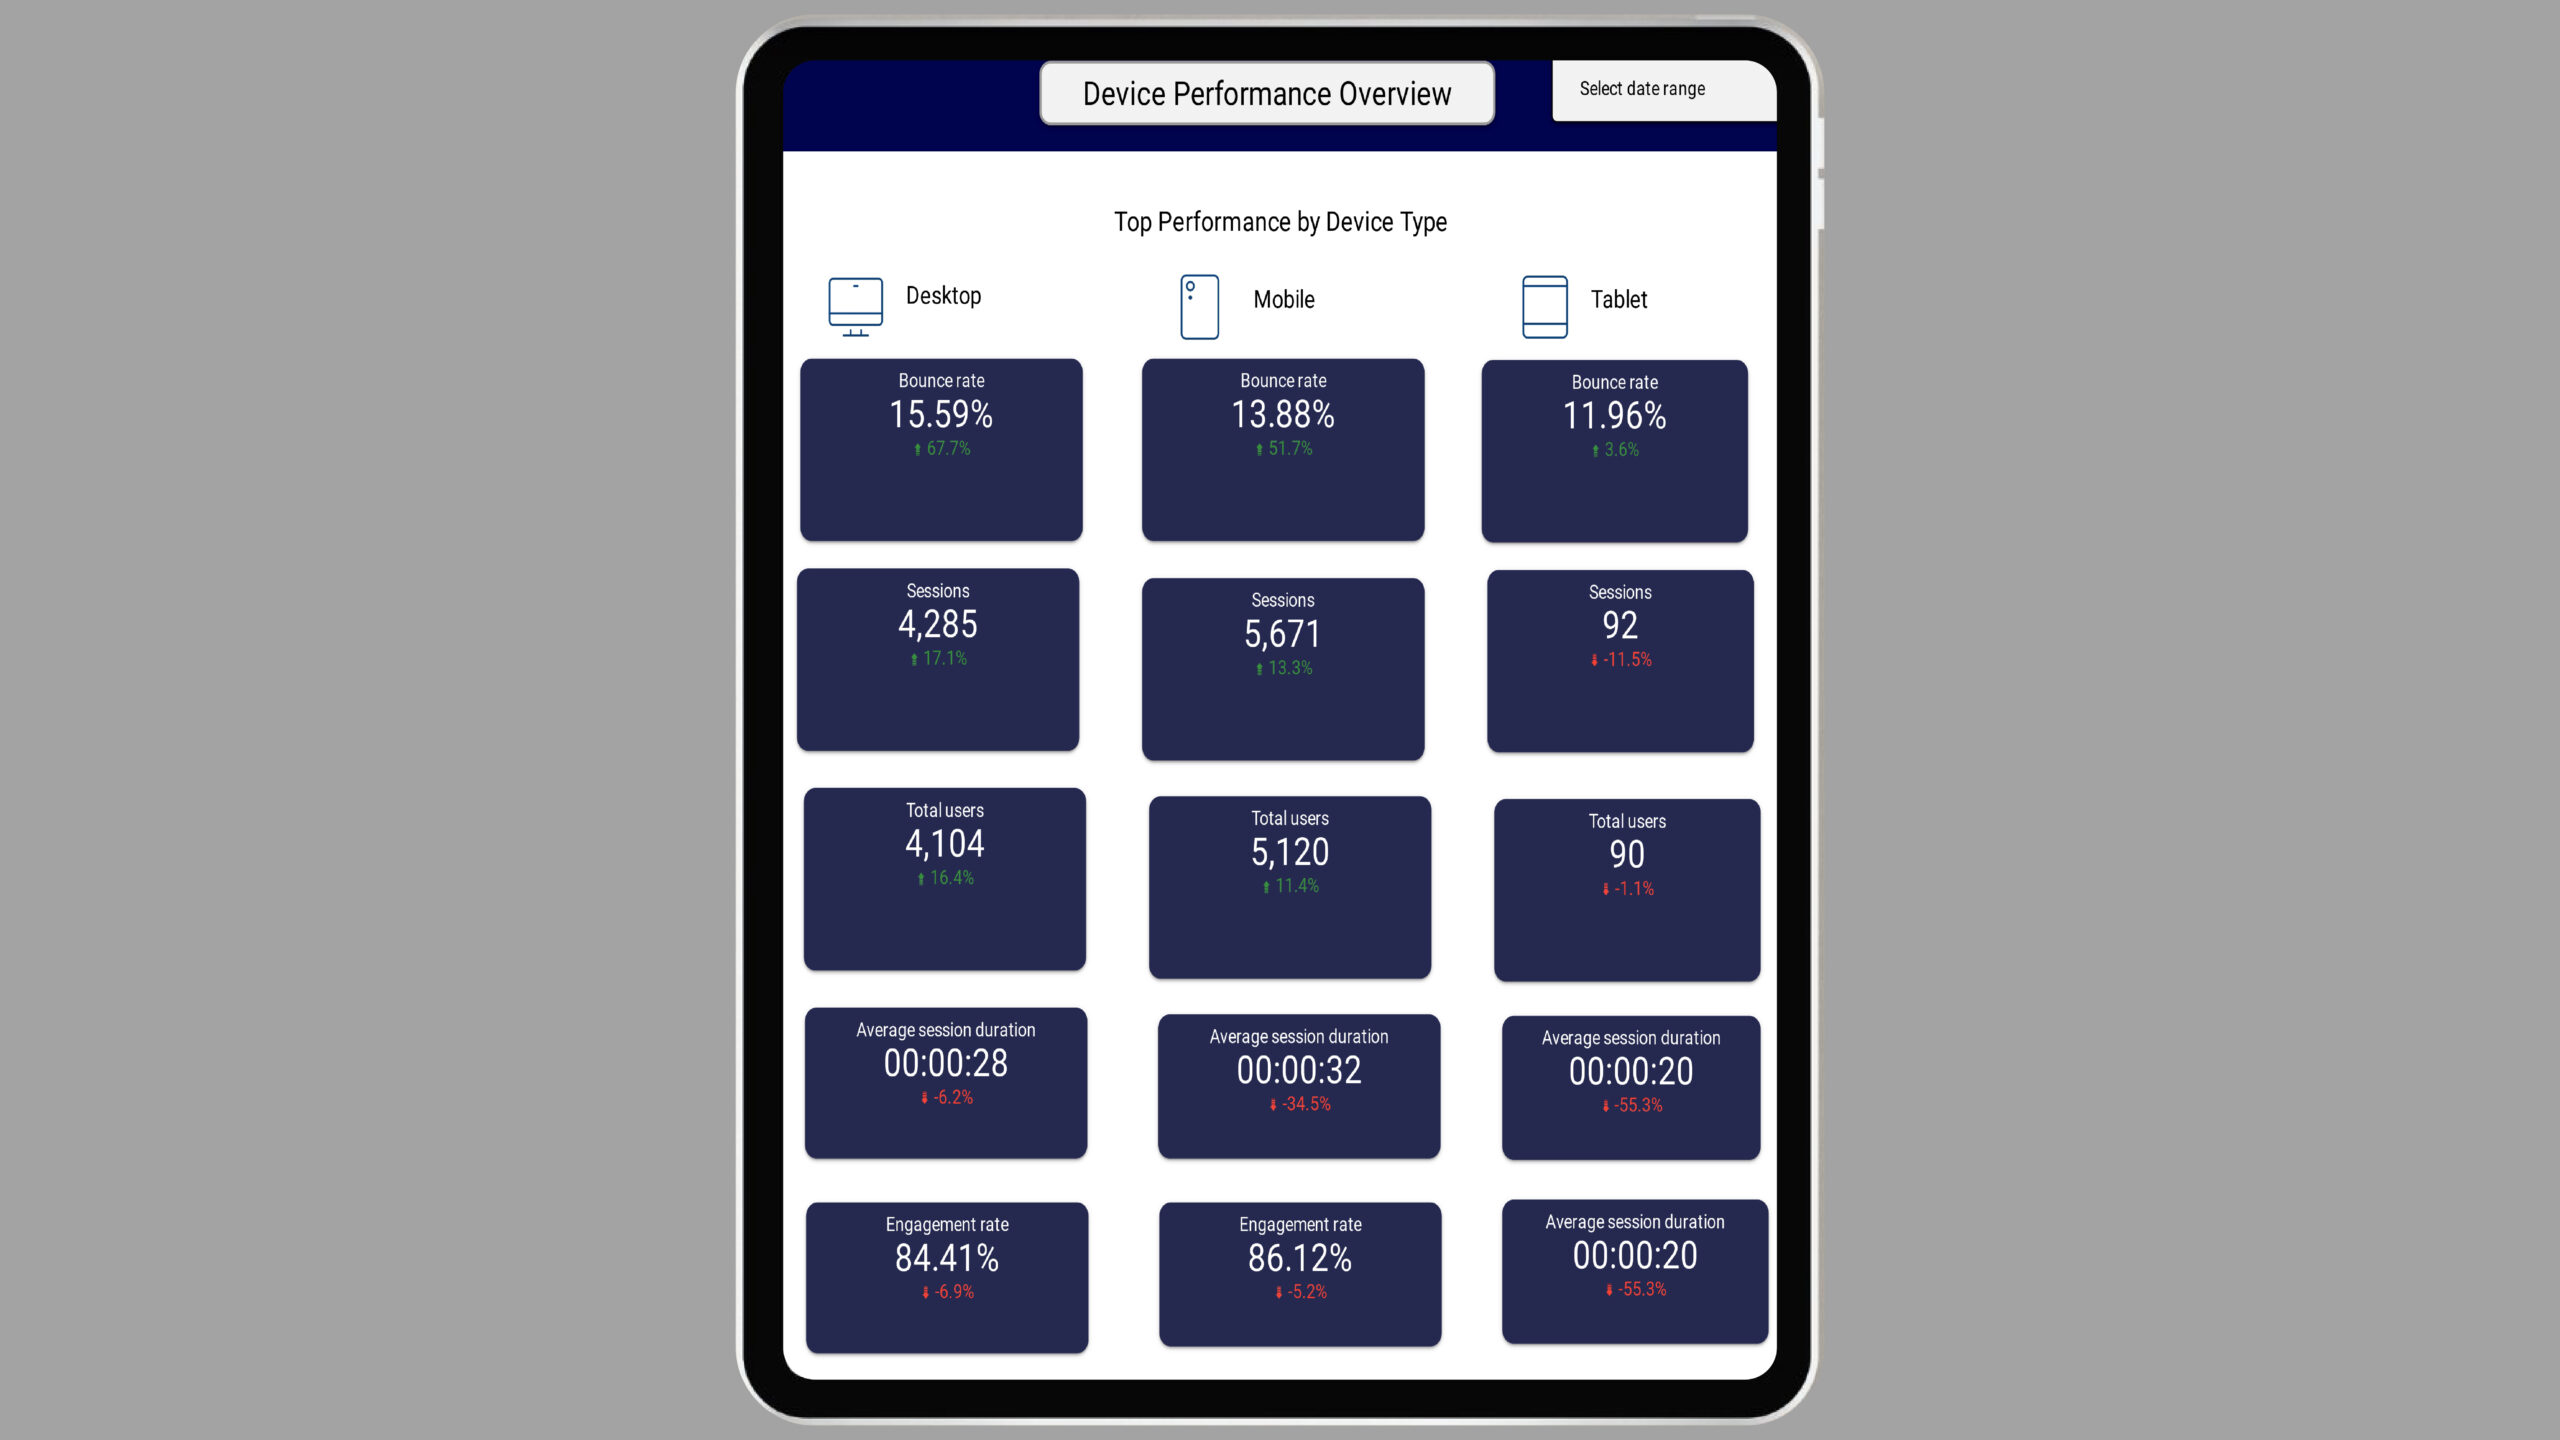
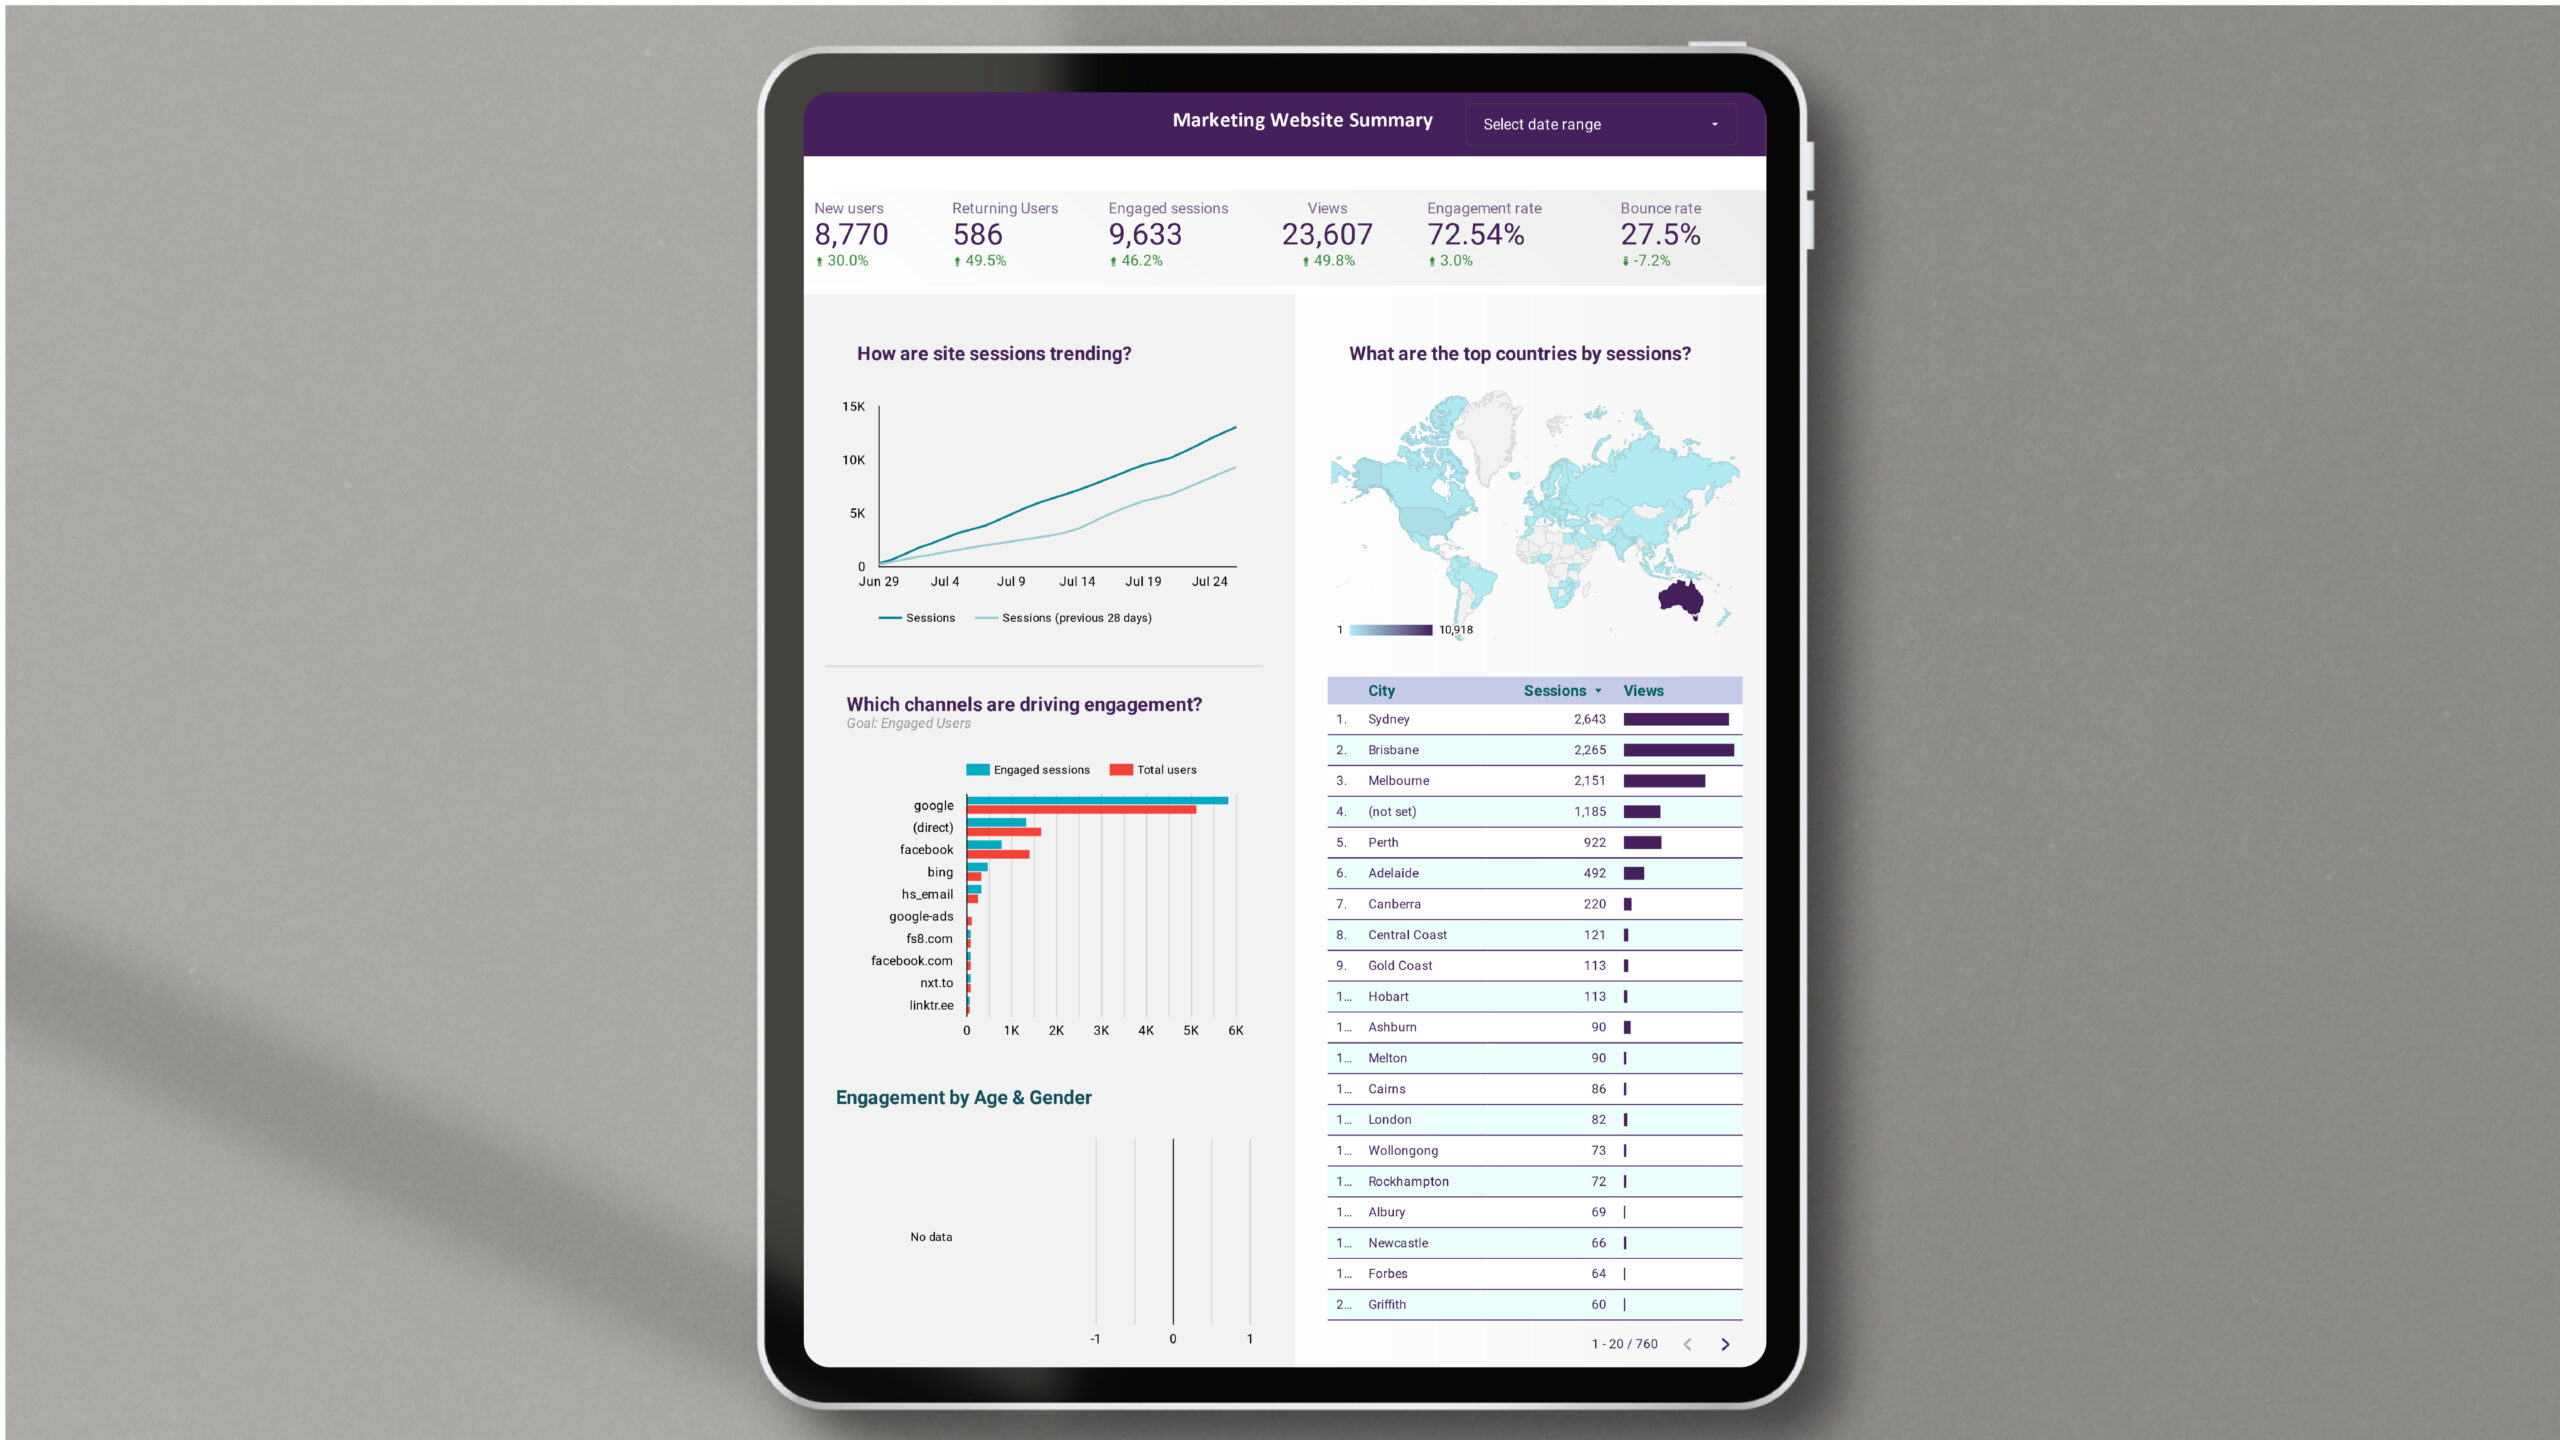
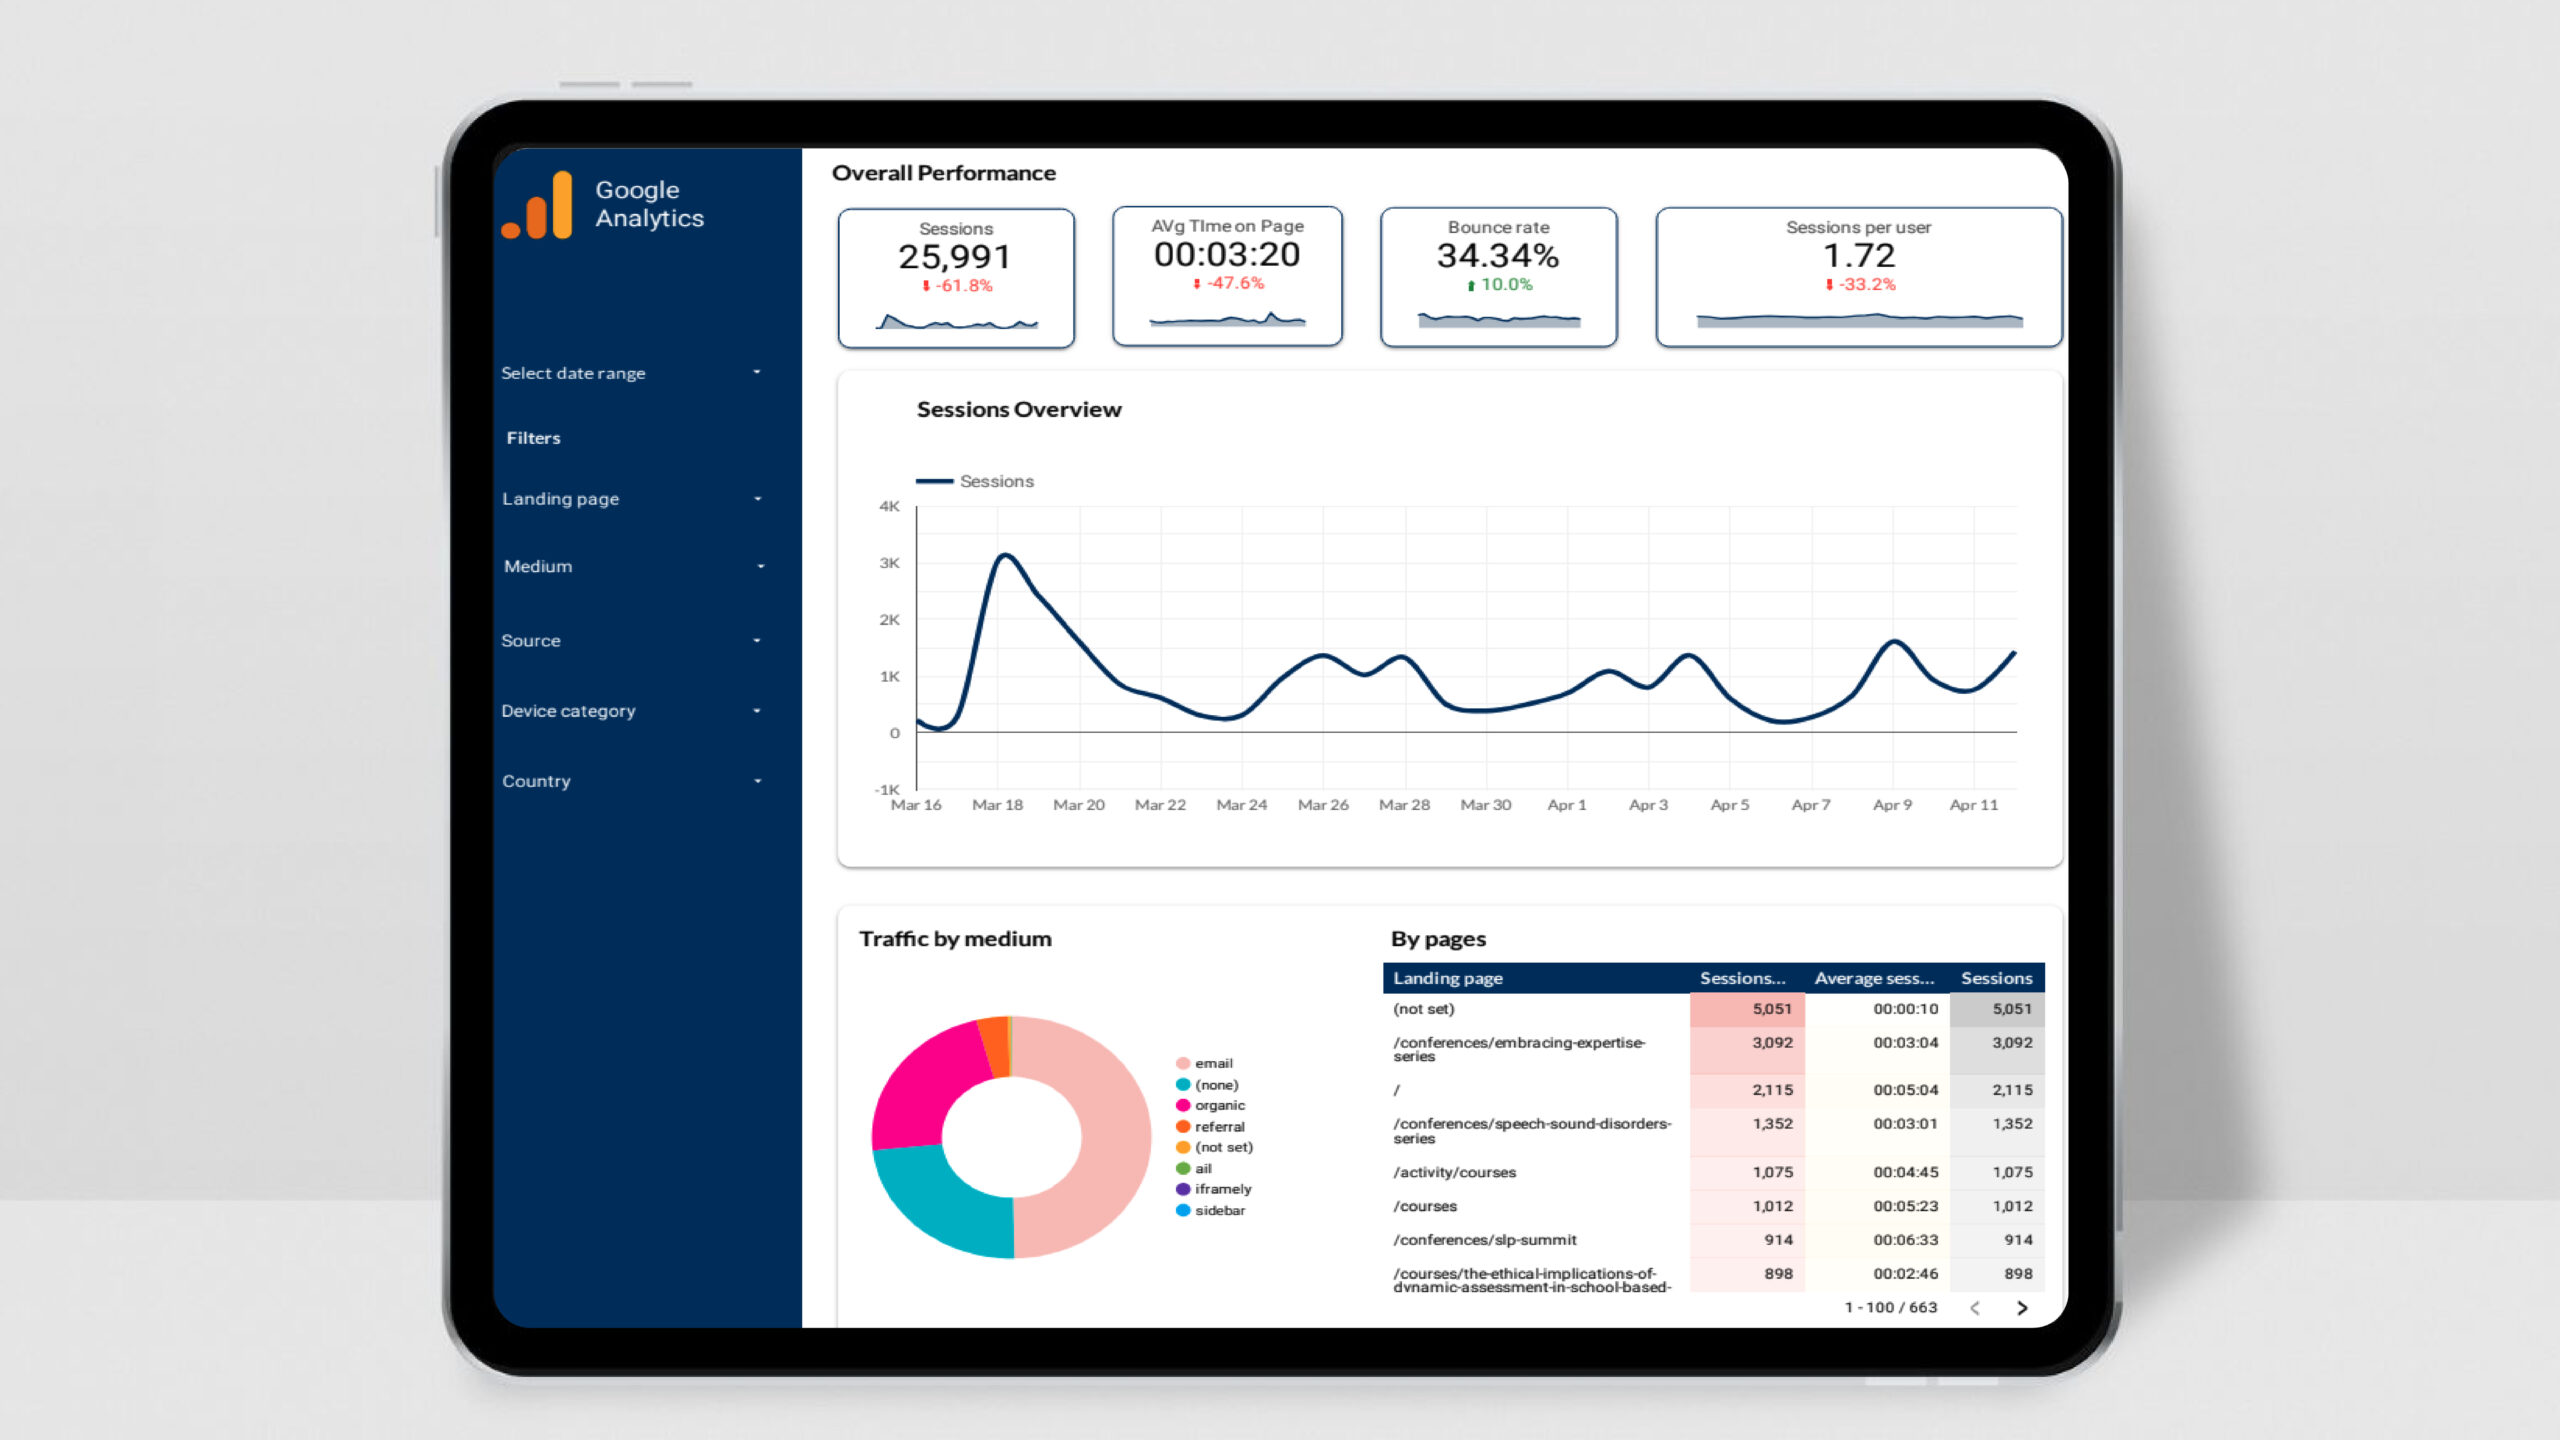
The Website Performance Dashboard by Device Category is an interactive reporting tool built in Looker Studio (formerly Google Data Studio) that tracks and analyzes your website’s key performance indicators (KPIs) based on the device type. It allows you to visualize and compare metrics for mobile, desktop, and tablet users in real time, helping you optimize for better user experiences across platforms.
Why Use Looker Studio for Device Performance Tracking?
Looker Studio is an intuitive and dynamic data visualization tool that integrates seamlessly with Google Analytics and other data sources. Using Looker Studio to track website performance by device category offers several advantages:
- Comprehensive Device Insights: Break down your website’s traffic and performance metrics by mobile, desktop, and tablet users.
- Real-time Reporting: Monitor up-to-date performance data across different devices to respond quickly to changes.
- Customizable Dashboards: Tailor the dashboard to highlight the most relevant KPIs for your business and target audience.
- Interactive Visuals: Present data through visually appealing charts, graphs, and scorecards, making it easy to analyze trends.
Key Metrics Tracked in the Website Performance Dashboard by Device Category
Here are some of the key metrics tracked in the Website Performance Dashboard by Device Category:
1. Sessions by Device
- Mobile Sessions
- Desktop Sessions
- Tablet Sessions
2. Bounce Rate by Device
- Mobile Bounce Rate
- Desktop Bounce Rate
- Tablet Bounce Rate
3. Average Session Duration
- Mobile Session Duration
- Desktop Session Duration
- Tablet Session Duration
4. Conversion Rate by Device
- Mobile Conversion Rate
- Desktop Conversion Rate
- Tablet Conversion Rate
5. New vs Returning Users by Device
- New Users (Mobile, Desktop, Tablet)
- Returning Users (Mobile, Desktop, Tablet)
6. Page Views by Device
- Mobile Page Views
- Desktop Page Views
- Tablet Page Views
7. Goal Completions by Device
- Mobile Goal Completions
- Desktop Goal Completions
- Tablet Goal Completions
8. Traffic Sources by Device
- Organic Traffic (Mobile, Desktop, Tablet)
- Direct Traffic (Mobile, Desktop, Tablet)
- Referral Traffic (Mobile, Desktop, Tablet)
- Social Traffic (Mobile, Desktop, Tablet)
9. E-commerce Performance by Device
- Mobile Revenue
- Desktop Revenue
- Tablet Revenue
10. Exit Rate by Device
- Mobile Exit Rate
- Desktop Exit Rate
- Tablet Exit Rate
Benefits of Using the Website Performance Dashboard by Device Category
1. Device-specific Optimization
Understanding how users behave on different devices allows you to optimize your website for each platform. Whether it’s enhancing mobile responsiveness or improving desktop user flow, the dashboard provides the data you need to make informed adjustments.
2. Enhanced User Experience
Tracking metrics like bounce rate, session duration, and conversion rate by device helps you identify areas where user experience can be improved. A high bounce rate on mobile, for example, may signal the need for a mobile-friendly design.
3. Targeted Marketing
By analyzing traffic sources and conversion rates across devices, you can allocate marketing resources more effectively. For example, if mobile traffic is converting at a higher rate than desktop traffic, it may be worth investing more in mobile-specific ads or promotions.
4. Increased Conversions
The dashboard enables you to identify which devices are driving the most conversions. Optimizing for those devices can lead to an overall increase in conversions and revenue.
5. Data-driven Decision Making
With the dashboard’s real-time insights, you can base your website improvement efforts on actual data rather than guesswork. Whether you’re launching a new campaign or making design changes, the metrics will guide you toward decisions that improve performance.
Who Should Use the Website Performance Dashboard by Device Category?
This dashboard is ideal for:
- Website Owners: Keep track of how your website is performing on different devices and optimize for a better user experience.
- Marketing Teams: Monitor device-specific traffic and conversion data to better understand your audience and improve campaign targeting.
- E-commerce Businesses: Track e-commerce performance by device category to optimize for higher revenue and conversions on mobile, desktop, and tablet platforms.
- SEO Specialists: Gain insights into how mobile-first indexing impacts your site’s performance, and make adjustments accordingly.
How to Get the Website Performance Dashboard by Device Category
Ready to gain powerful insights into your website’s device performance? Purchase the Website Performance Dashboard by Device Category in Looker Studio today and start optimizing your site for all users, regardless of device. In a multi-device world, optimizing your website for different platforms is essential for success. The Website Performance Dashboard by Device Category in Looker Studio gives you the tools and insights you need to ensure your website performs seamlessly across all devices, ultimately driving better user experiences and higher conversions.
FAQs
Q: How do I connect my Google Analytics to the dashboard?
A: After purchasing the dashboard, you will receive a step-by-step guide on how to integrate your Google Analytics data into Looker Studio.
Q: Can I customize the dashboard?
A: Yes, the Website Performance Dashboard is fully customizable to fit your specific needs and focus on the KPIs that matter most to your business.
Q: Does the dashboard work with other data sources?
A: Absolutely! In addition to Google Analytics, Looker Studio allows you to integrate data from other sources, providing a comprehensive view of your website’s performance.


