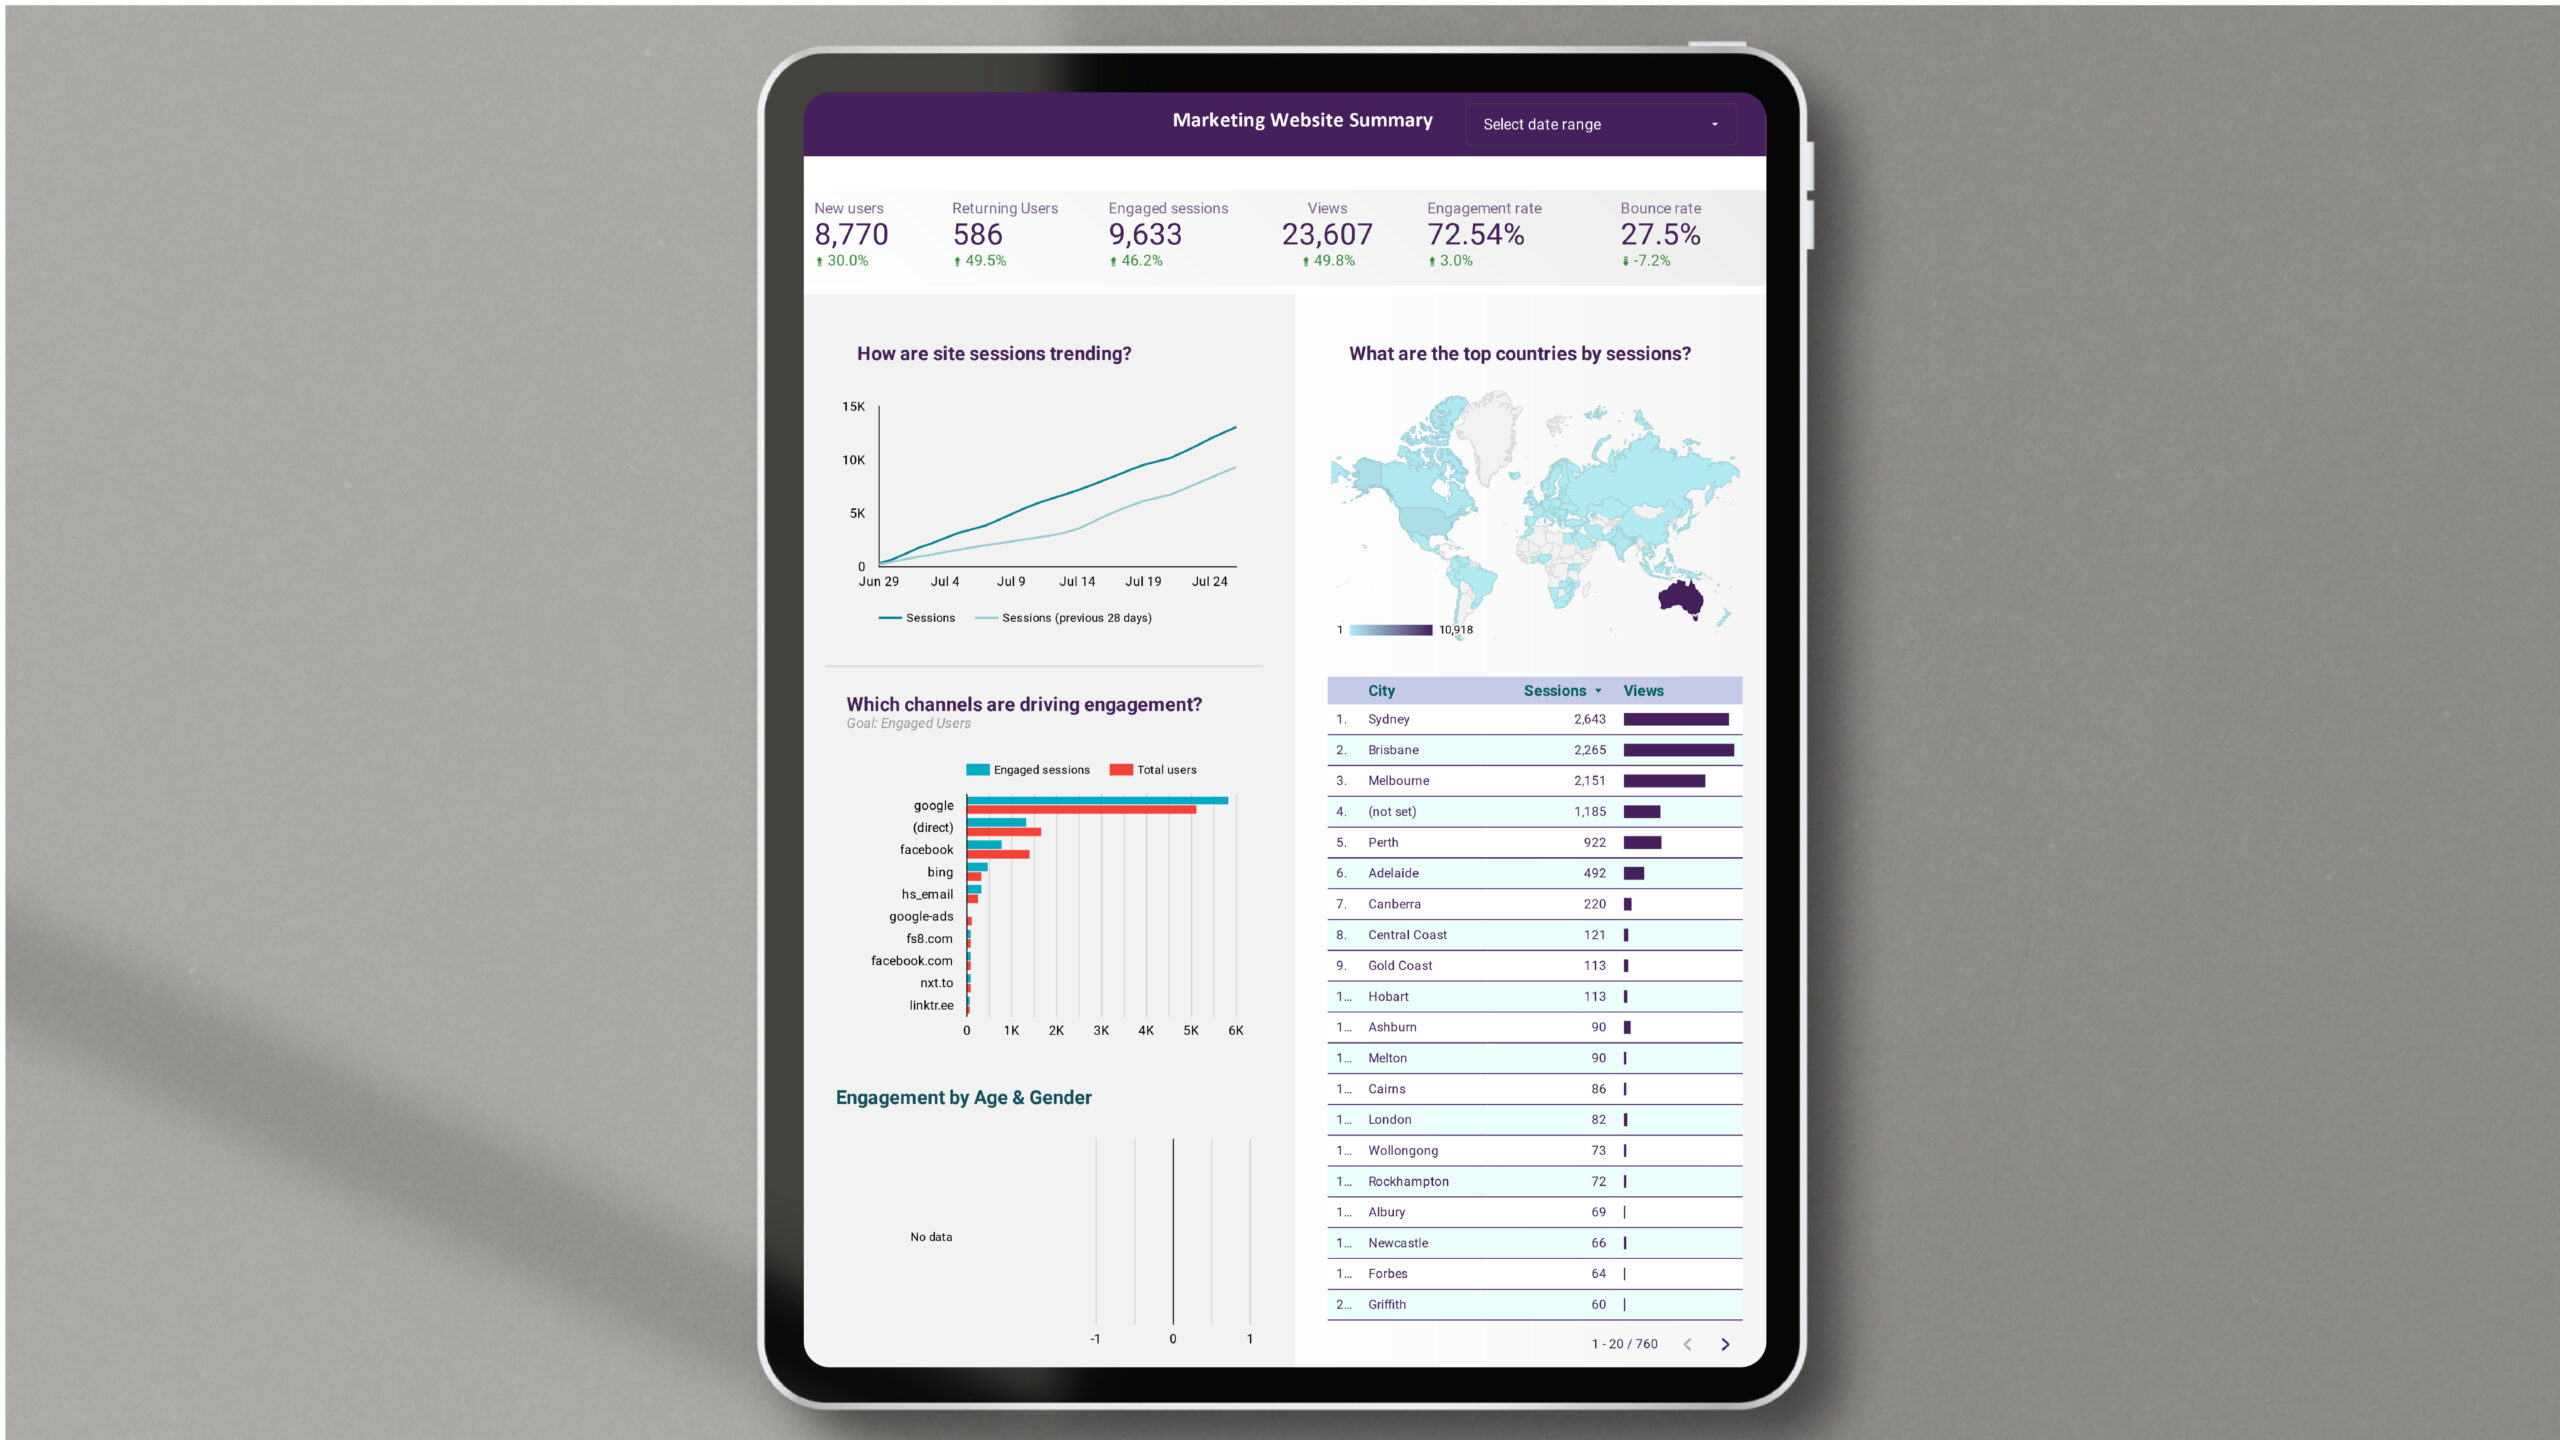
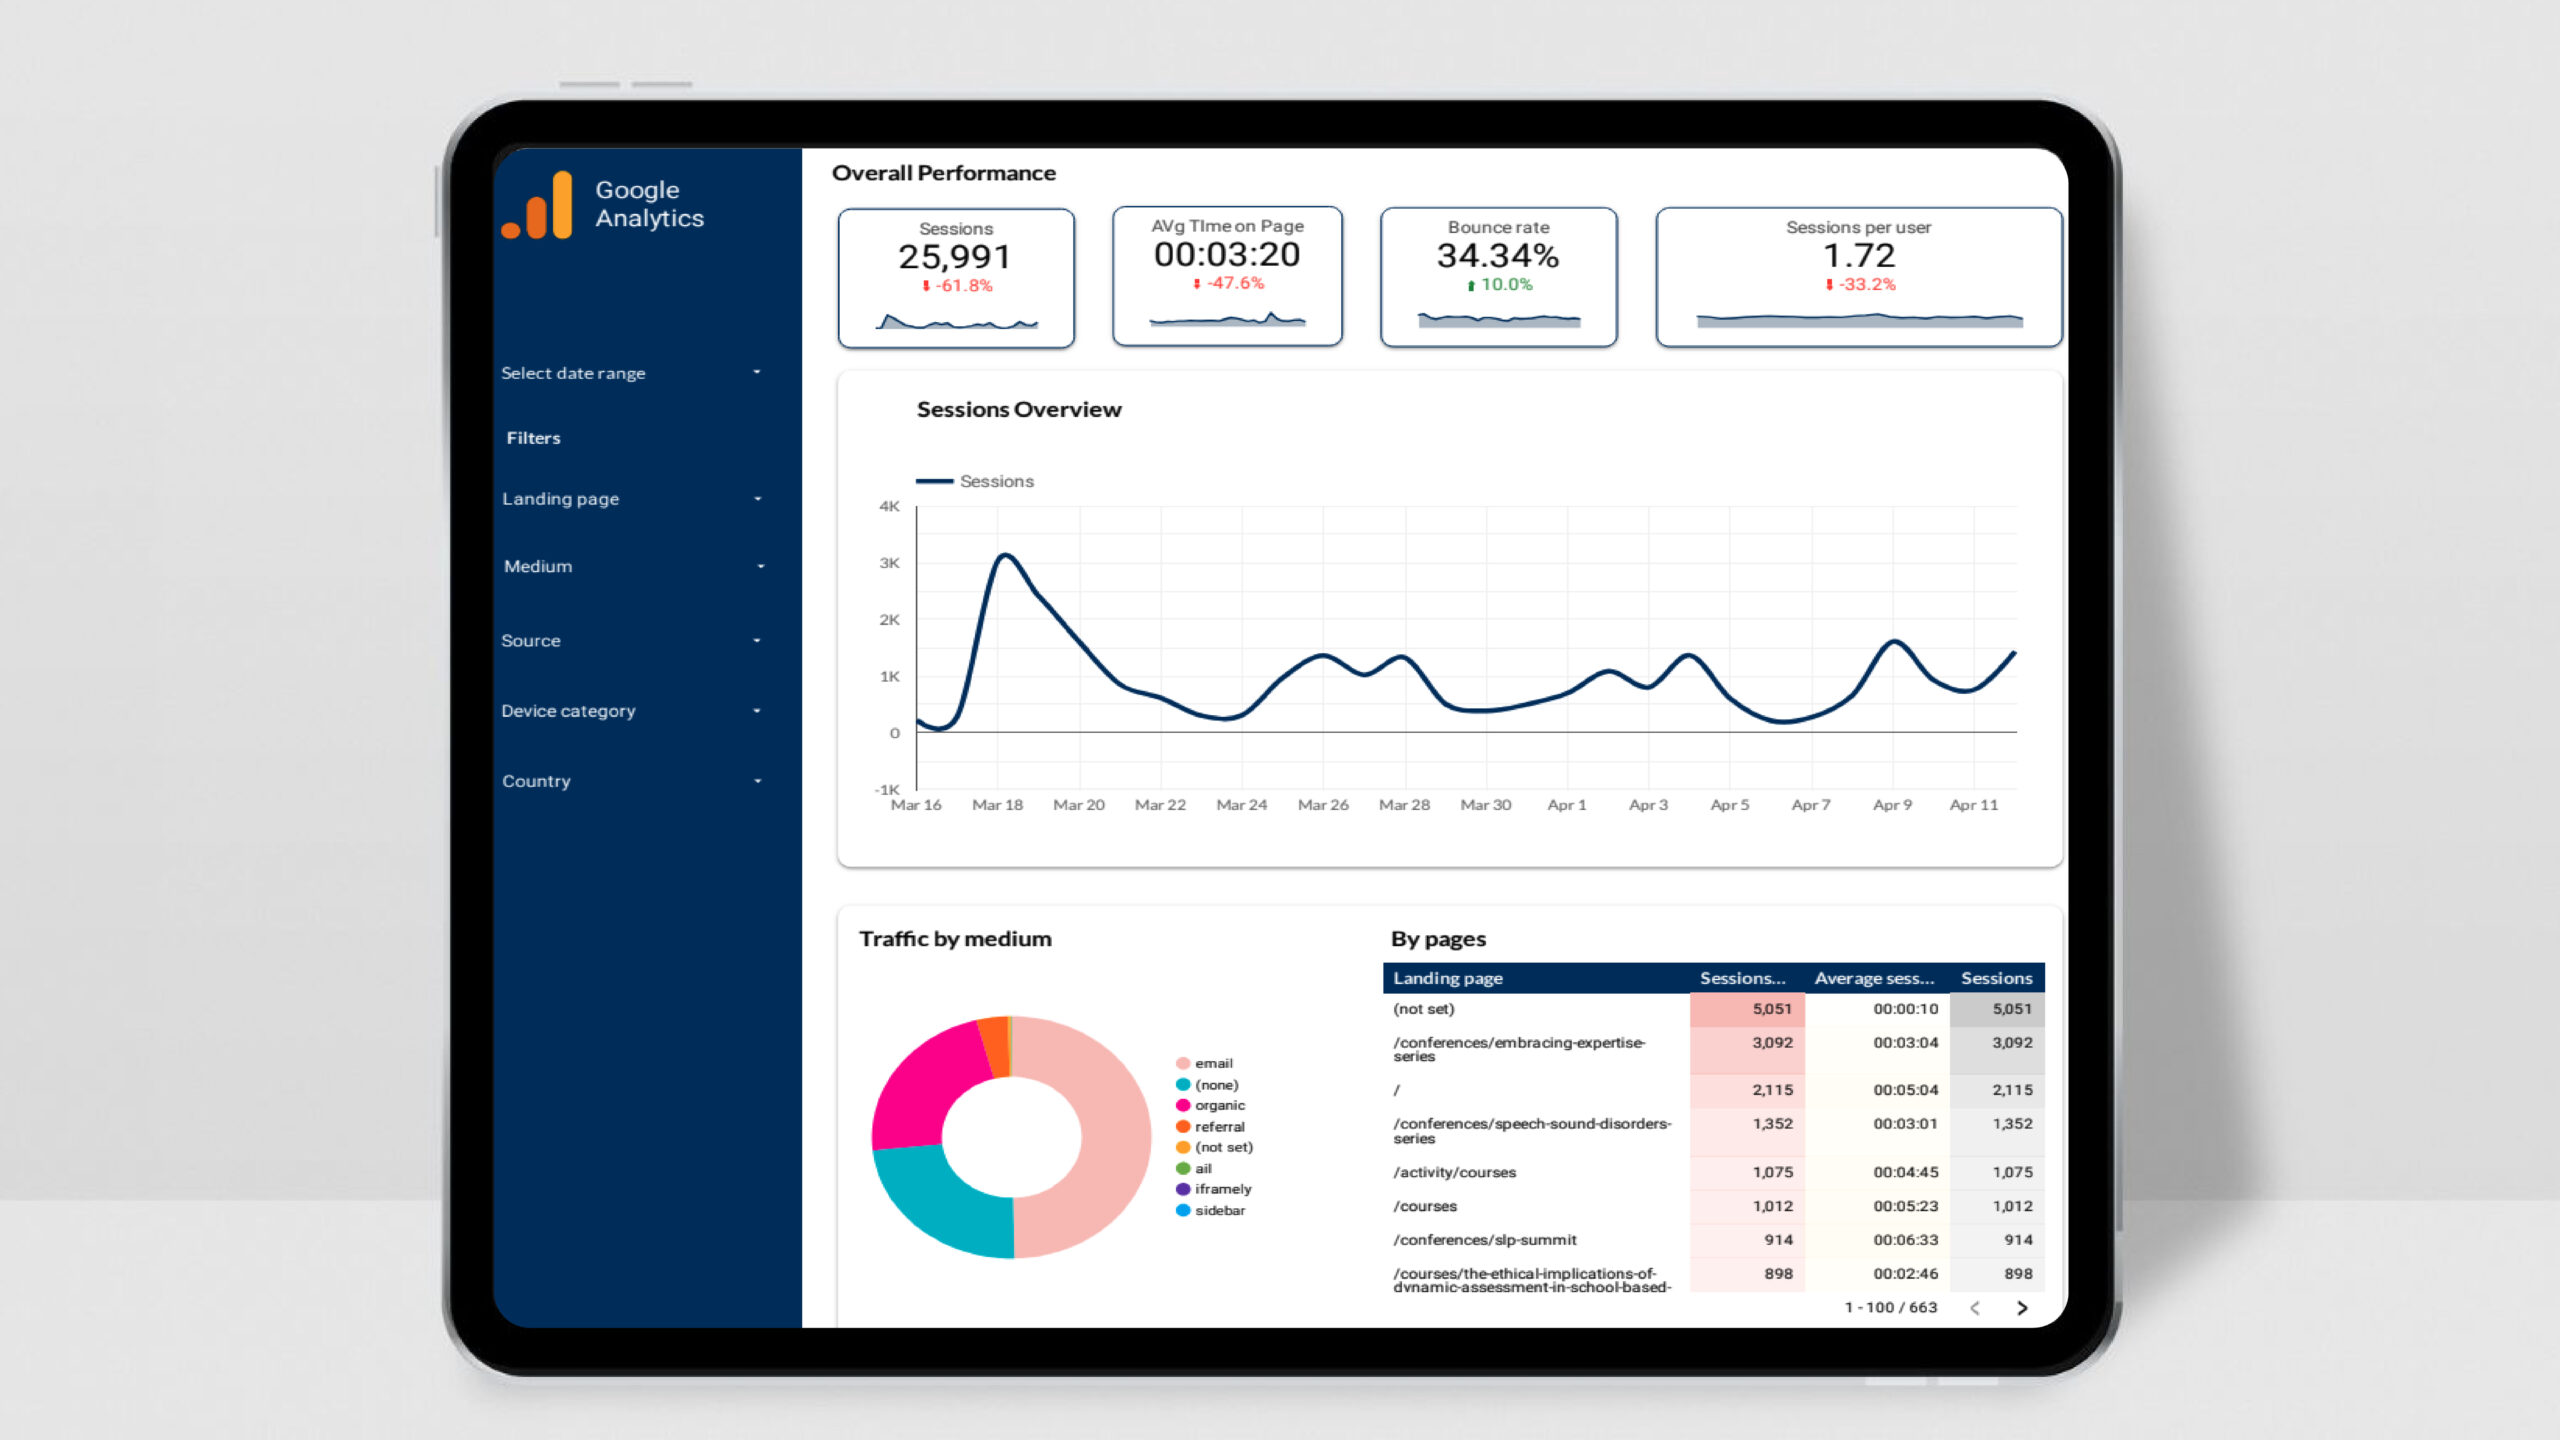
Why You Need a Website Traffic Scorecard Dashboard
The Website Traffic Scorecard Dashboard offers an intuitive way to monitor website performance metrics in a single view, saving you the hassle of sifting through multiple reports or platforms. It allows you to track how users are finding and interacting with your website, making it easier to spot trends, opportunities, and potential issues.
With a focus on website traffic, this dashboard will help you:
- Understand how different channels (organic, paid, social, etc.) contribute to your overall traffic.
- Identify areas where your audience is engaging most with your content.
- Spot potential opportunities for optimization, such as improving user experience or tweaking marketing strategies.
- Track website performance over time with historical comparisons and trend analysis.
Key Metrics to Track in the Website Traffic Scorecard Dashboard
The Website Traffic Scorecard Dashboard focuses on the most important traffic-related metrics that give you a clear picture of how your site is performing. Here’s a list of the key KPIs that can be tracked:
1. Total Website Visits
- Sessions
- Users
- New vs Returning Users
2. Traffic Sources
- Organic Traffic
- Direct Traffic
- Referral Traffic
- Social Traffic
- Paid Traffic (e.g., Google Ads, Facebook Ads)
3. Device Breakdown
- Traffic by Device Category (Desktop, Mobile, Tablet)
- Bounce Rate by Device
- Average Session Duration by Device
4. Geographical Traffic
- Traffic by Country
- Traffic by Region/City
5. Top Landing Pages
- Page Views by URL
- Sessions by Landing Page
- Bounce Rate by Landing Page
6. Engagement Metrics
- Bounce Rate
- Pages per Session
- Average Session Duration
7. Traffic Trends
- Day-over-Day Traffic
- Week-over-Week Traffic
- Monthly Traffic Trends
8. User Behavior Flow
- Most Common User Paths
- Entry Pages
- Exit Pages
9. Channel Performance
- Traffic from Organic Search
- Paid Traffic from Ads
- Traffic from Social Media Channels
- Referral Traffic
10. Real-Time Traffic
- Active Users
- Top Active Pages
- Geographical Distribution of Active Users
Benefits of the Website Traffic Scorecard Dashboard
1. Comprehensive Overview
This dashboard provides a complete, high-level view of your website’s traffic data, consolidating key performance indicators in one place for easy analysis.
2. Customizable Metrics
Tailor the dashboard to include metrics that are most important to your business, whether you’re focusing on organic search traffic, paid ads, or user engagement.
3. Real-Time Data
With real-time integration from Google Analytics and other platforms, you always have access to up-to-date traffic information, allowing you to make quick adjustments to your marketing strategy.
4. Easy-to-Use Interface
The Website Traffic Scorecard Dashboard features a clean and intuitive layout, making it easy to interpret the data at a glance without needing advanced technical knowledge.
5. Actionable Insights
With a clear understanding of where your traffic is coming from and how users are interacting with your site, you can take immediate actions to improve your website’s performance, such as optimizing landing pages, targeting the right traffic sources, or improving user engagement.
How to Get the Website Traffic Scorecard Dashboard
Ready to gain a deeper understanding of your website’s traffic? You can purchase the Website Traffic Scorecard Dashboard for Looker Studio on our website. This fully customizable template allows you to monitor and visualize critical traffic metrics, helping you drive meaningful insights and optimize your digital marketing efforts.
Conclusion
The Website Traffic Scorecard Dashboard in Looker Studio is an invaluable tool for anyone looking to gain clear and actionable insights into their website’s performance. By tracking the right metrics, this dashboard enables you to monitor your website’s traffic sources, user engagement, and overall traffic trends—empowering you to make data-driven decisions that will help improve your website’s performance and grow your business.
Don’t wait—start optimizing your website’s traffic strategy today with the Website Traffic Scorecard Dashboard!


